Many of you already use .dset files - datasets in the native EasyMorph format. At this point, their role is similar to that of data files produced by Tableau or Qlik but this role will change, or more precisely, expand.
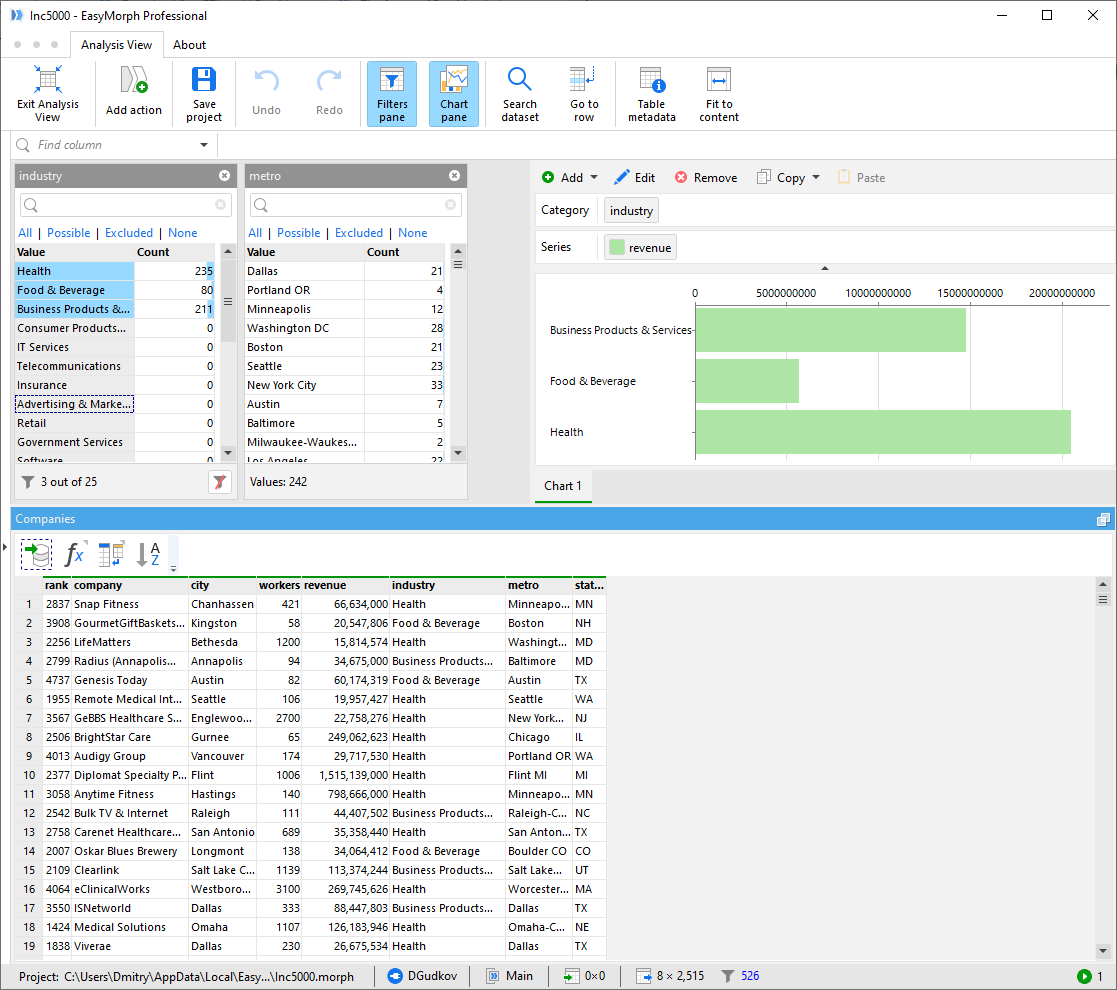
Starting with version 5.2, when a .dset file is generated, EasyMorph also writes in the .dset file the Analysis View of that dataset (in a workflow or in the Data Catalog). An example of Analysis View is below. It contains interactive filters and charts for a dataset.
Why does it do that?
That's because we want .dset files to become "the PDF of data analysis": a lightweight, portable, immutable, convertible format with an open specification. We do it because we want to simplify sharing data and results of data analysis between people. We think the current way of doing it is not always convenient.
Also, the data files generated by Tableau (.hyper) or Qlik (.qvd) are intended for machines. We want to make .dset files usable for machines AND people.
Immutability
The key word in the description above is immutable. The problem with the current BI reports is that they are usually not immutable. They depend on an external data source. When data in that external data source changes, they change too. Therefore you can never be sure that if you open the same report tomorrow it will have the same data.
Annotations
Immutability is quintessential for data annotation. In the future, we will add the ability to bookmarks and annotate selections in the Analysis View. So when you open a bookmark of a dataset, the necessary selections are made automatically and you can read in the annotation someone's remarks on it. For instance, if you explored a dataset obtained from the Data Catalog or in a workflow and found something worth of attention - an unusual trend, a suspicious set of transactions, or a data quality issue. You can immediately bookmark the selection, annotate it, and export as a .dset file to share your findings with someone else.
Sharing
When someone else opens a dataset (.dset file) with annotations, they can see your remarks and keep analyzing data, or export the dataset or a subset of it in Excel or a CSV file, or open it in EasyMorph's workflow editor for wrangling and shaping.
The receiving person doesn't have to use EasyMorph for viewing datasets. Soon, we will be updating our CSViewer. It will support .dset files and will have charts (and later bookmarks and annotations) in the Analysis View. CSViewer is a simple lightweight utility that will always remain free. It will have the same role for .dset files as Acrobat Reader has for PDF files.
Encryption
Of course, datasets may contain sensitive data that shouldn't be open to everyone. The .dset format already supports encrypting and password-protection for all or only selected columns of a dataset.
Interoperability
The format of .dset files is open, not proprietary, and we provide open-source tools to access .dset files programmatically.
Why not X?
Why design something new? That's always a good question. Here is why I think having a "PDF for data" can be more convenient in some cases that the existing ways of sharing data.
Currently, the most common way of sharing findings is to write your findings in an email and attach an Excel spreadsheet with underlying data. It's actually pretty convenient when your underlying data only has a few rows and your finding fits in a sentence or two. However, if your data is thousands or tens/hundreds of thousands rows and you have multiple findings related to different subsets of it, this way of sharing insights becomes less convenient. AFAIK, Excel doesn't have the concept of bookmarks, and has no an equivalent of Analysis View ready out of the box. Of course, you can add filters to a spreadsheet and create charts and pivot tables in it - it just takes time to do it for every spreadsheet your receive.
A BI report (e.g in Power BI or Tableau) is another way of sharing insights. Here you have pre-built charts, filters and whatnot. I see a few problems with the current BI tools:
- Web-based BI reports are not immutable, so annotations in them make no sense. You never know for sure if the annotations you see are still relevant or not because the underlying data has changed.
- Immutable file-based BI reports (e.g. Tableau workbooks) are good, but in my opinion they are too design-heavy. You may have many insights during the day. Designing a layout for a BI report for every insight you might have seems like an overkill. Current BI tools are designed for report re-usability, not for speed and simplicity. If sharing an insight takes longer than writing an email and attaching a spreadsheet - it takes too long. Also, if you need to wrangle report data a bit more seriously you can be out of luck - most BI tools are designed for re-usable data visualization, not ad-hoc wrangling.
- Screenshots - good for quick annotations of a small subset of data. Horrible for everything else.
- PowerPoint slides - good for story-telling. Immutable. However, row-level data is unavailable and no way to analyze/transform data further.
Conclusion
I believe, the Analysis View in EasyMorph datasets has the right balance for simplicity of design and ease of use. It's a lightweight and interactive format/tool that fills the gap between a dull tabular spreadsheet and a heavy-featured BI report. The tight integration with EasyMorph's workflow designer, and easy convertibility to other file formats offer the user many paths for what can be done with data further.
Roadmap
| What | When |
|---|---|
| The .dset format | Ready |
| Analysis View in .dset files and datasets in the Catalog | Q2-2022 (v5.2) |
| Support for .dset in CSViewer | Q3-2022 |
| Support for encrypted columns in CSViewer | Q4-2022 |
| Bookmarks and annotations in Analysis View and .dset files in EasyMorph and CSViewer | 2023 |