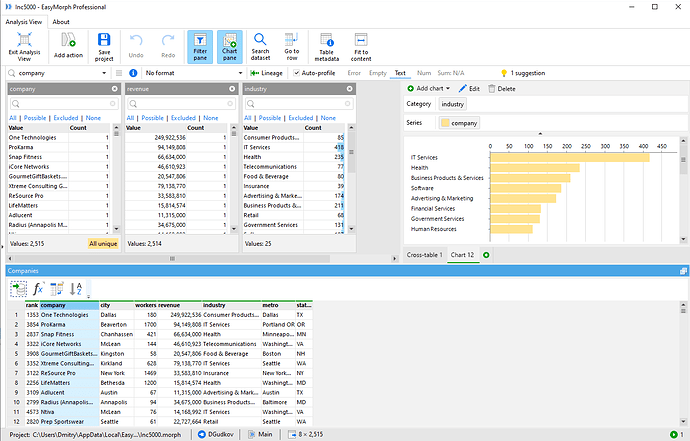
Here is a preview of cross-tables. Features:
- Derived similarly to tables and charts
- Multiple dimension columns (shown all at once)
- Single dimension row at a time (can be selected from many)
- Single aggregation metric at a time (can be selected from many)
- Column with totals
- Row with totals
- Sorting for row dimensions and for column dimensions
- Background color gradient (not shown in the screenshot below because it’s not ready yet)
Cross-tables and charts will also be available in the Analysis View (see below). Analysis View becomes a pretty good data analysis tool, and will be available in new places, e.g. in Launcher (but not in 5.0, in later versions) as part of our big strategy of building a last-mile data delivery platform.

