Hi team !
I'm so excited to see how it works, don't hesitate to tease if you have something to show ^^
Hi team !
I'm so excited to see how it works, don't hesitate to tease if you have something to show ^^
I'll post a preview of cross-tables in a week ![]() The Excel report generator is not ready yet.
The Excel report generator is not ready yet.
Here is a preview of cross-tables. Features:
Cross-tables and charts will also be available in the Analysis View (see below). Analysis View becomes a pretty good data analysis tool, and will be available in new places, e.g. in Launcher (but not in 5.0, in later versions) as part of our big strategy of building a last-mile data delivery platform.
Hi,
Multiple dimension in row I think you mean, and one column only. Generally speaking its how I imagine it so it seems fine to me.
The limitation of one single metric is not a good news because our users usually display multiple, like amount N1 vs amount N, common comparison use case. Hope it can be done later then, or improved before release.
Sounds (and looks) great. Can't wait to get it.
Hi,
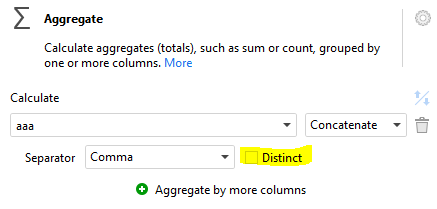
In the aggregate function, could we have concatenate distinct.
Regards
Right you are, I will propose this as new feature if you dont mind, so it can be more "visible"
What Will the ”excel report generator” be when it’s finished?
I’m wishing for a way of opening an excel file to append/ replace/ edit data without affecting formatting or other excel functions.
Hi Emil and welcome to the Community!
The "Excel report generator" will generate from scratch new Excel spreadsheets with formatted tables. It won't update existing spreadsheets.
You can already replace sheets in existing Excel workbooks with the "Export to Excel" action. Create a spreadsheet with 2 sheets - one with raw data, one with formatted tables referencing the sheet with raw data. Replace the sheet with raw data with EasyMorph. Use the "Excel command" action to recalculate sheets, if necessary.
@CraigT do you have anything to add here?
Hello Emil and Dmitry.
Dmitry is right for a straightforward process of creating Excel reports. Data on one sheet, the report layout on another, with formulas pulling the raw data into the template. As EasyMorph's "Export to Excel" action updates the data, the report template updates.
To "batch" this process, you'll need a small macro to "Export to PDF" within Excel to create the output report file. For each set of data passed in from EasyMorph, you get a report output. So, after exporting the new data to Excel, trigger the macro with the Excel Command action in "Run VBA macro" mode to trigger the output process.
If you're making really granular changes to the data - updating a value, or a few - you can create an Excel macro to do this and pass in the updated values via arguments. Of course, the macro will need to know what to update, so I would pass in a concatenated value like "A2|14", with A2 being the target cell and 14 being the updated value. Have the macro split the value (by the pipe delimiter), use the "A2" in a Range reference, and the "14" (or other value) as the value to update to.
Finally, if you need to do something fancy in the report prior to exporting to pdf - i.e., color-code cells, perform ad hoc calculations, hide/show rows, change titles, etc.) - I would build that into the Excel macro, with the "write out to pdf" process being the final step. Export from EasyMorph to Excel the updated data (into a sheet), run the Excel Command > "Run VBA macro" to run the process that formats, etc., and outputs the final pdf.
Send back any further questions you may have, Emil. I'd be happy to chat about this more. ![]()
Craig
Hello guys.
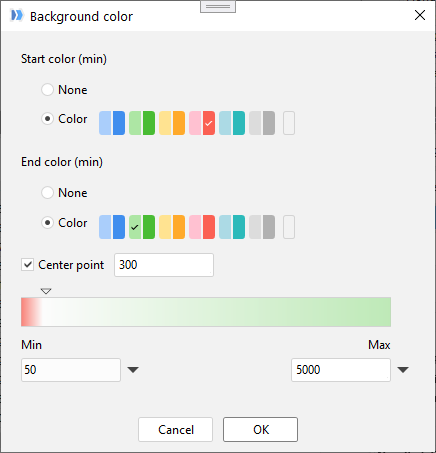
I am very interested in this background color feature in cross tables, but can't find it anywhere.
So far I am using the 5.1.2.2, Free desktop edition.
Did I miss something ?
Thanks and regards,
David
Hi David and welcome to the Community!
The "background colors in cross-tables" feature has been postponed. Currently, there is no deadline or release date for it.
Thanks for the warm welcome ^^
OK, duly noted !