Dmitry,
I followed your instruction from the other topic of the forum. I have 10 list of csv files with 50 rows each. I wanted to show the last row of of each file in rows (10 rows). I loaded one file and trim it to show only one last row (latest by date). I created another project list of files and call the one file to iterate but I got 10 rows but the result in each cell of each column became zero. I could not figure it out where I mess up. Thanks
Do you mind sharing your project files with a couple of the csv files here?
Yes I share indeed. Here is file I was working. The final result in the cells are not correct at all. I miss something in doing it correctly.
iterate.zip (3.3 KB)
You did almost everything right. Just a couple things missing:
- A parameter should be used instead of hardcoded file name in main.morph
- That parameter’s value should be assigned with a full file path in Iterate transformation in list.morph. This will override whatever default value that parameter had.
Here is your updated example. I’ve added a few annotations.
iterate.zip (3.3 KB)
Dmitry,
I found it difficult to understand, full path file name, file name and parameters at first. But now I get it. I think iterate must be one of the main and powerful part of easymorph. I would like to go in depth. Thank you for such technical support you are providing.
Eyasu
1 Like
Dear Dmitry,
Greetings. It has been a while since my past communications. I have dealt this question before. But I found not to figure out why it doesn’t give me more than 8 occurrences in all my files. To give you an example here is of a temperature of every day categorize in levels. I want to find out in which level was the temperature occurrence and which day. Then find out the total or sum of occurrences. When I do it manually it is 13 occurrence as shown in my chart, but when I compute in the past it does not occur more than 8 times in all my files. As you can see there are are 16 blocks (options) where it could have happened. Can you please help? Thank you
Eyasu
Dm.csv (172 Bytes)
Hi @eyasu,
can you please provide more details and definitions – I don’t understand your question. What’s an occurrence, what’s the total sum of occurrences, what do you do when you do it manually? What does it mean “compute in the past”? What’s the source data? Examples would be appreciated. The more examples the better.
Thank you
Since I have asked you similar questions I thought you get it, but how many do one expect you to remember everyday of every one, I am sorry. OK here is the case and this scenario helps for many things.
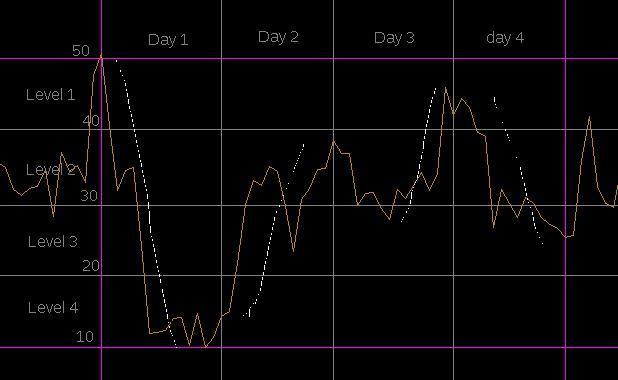
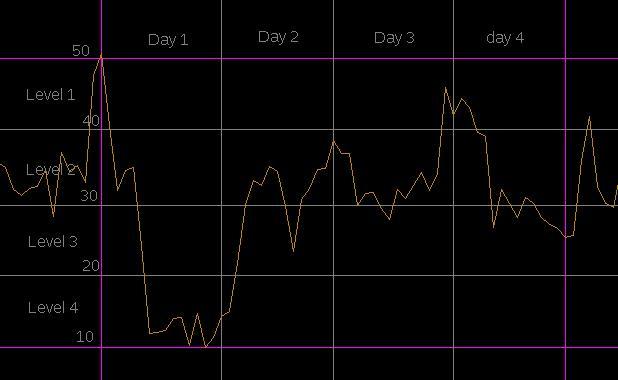
- The chart you see is temperature happened in 4 days. The yellow line is the temperature with degree vertical and Time horizontal. But I don’t have chart except csv, I attached it for you to understand.
- The only information I will have is the daily high and low degrees in csv.
Case
- The four day temperature is classified into four equal categories, level 1, 2, 3, and 4. Meaning: very very hot, hot, mild and cold. I have classified manually in my csv bottom part for you to understand. As you see in the chart there are 16 blocks in total (4x4), Days and Levels.
Problem to solve
- How many times in total does the temperature touches the blocks (out of the 16)?
To solve
So we create the matrix first where the temperature was in the category and when. I gave the block “one” if it occurred otherwise empty. Then I add up the total of “one” to find the times of occurrences.
Is it clear Dmitry? If we want to be fancy at last we can classify even to be as cold, mild, hot and very hot; else the temperature was freezing or very very hot below 10 or above 50. But that is not my interest. I am interested for now the total occurrences.
If a temperature touches a block twice – is it one occurrence or two?
If is in one time frame and one level it is ones if it is in another time or level it is two, if it is again in another time or level it is three.
I assume from your answer that if a temperature touches the same block twice it’s one occurrence, not two.
Now let’s get back to your original question. Can you please provide an example that includes:
- Your source data
- The EasyMorph project that performs calculations for the past data that gives you 8 occurrences
- Manual calculations performed on the same source data that result in 13 occurrences.
Yes if it touches the same block ones or trice it is one.
I think I feel I let you misunderstood me or maybe did not explain very well in the past as I did now. Because we can clearly see what it looks like manually as you can see in the chart touching 13 blocks. If what I am asking you now is new to you it is definitely I did not explain well to you in the past when we were discussing in our email conversations. You may find it in our last email attachments you sent me as I have no access to see it as it contains more than 30 transformations. I assure you it is my own explanations and my own inability to do the long calculations.
This is the easiest possible way for me to understand.
@eyasu, I understand the idea about occurrences and blocks. I’m not sure I understand what kind of help you need. Without clearly provided explanations I’m afraid I can’t do much.
I did manually with the aid of charts and manual classifications to get the total 13 occurrences. The only info I have is the high and the low of the day. How do I get the total occurrences using easymorph without doing it manually. I know for sure am not paid enquirer yet, but hopes to get any help till I purchase. Thanks
Would you be able to provide me with the data set (data points) you used for plotting the chart in a text file or spreadsheet? Or it’s OK for you if I make an example using random data (in this case the number of occurrences will depend on data and may not be exactly 13)?
PS. I do my best to provide help, although I need clear explanations and answers to my questions. Without that I can’t do much.
No, I don’t get any data set. I only get the high and the low of every day. I have to create my own by taking the high and low of the 4 days in order to plot the 4 levels, 1, 2, 3, 4 ( very hot, hot, mild and cold) my self. I wish if you use the csv I sent you which is at the top part of my attachment, not the bottom (as I did the bottom for you to understand).
The chart is for you to understand what the back ground was. everything has to be done from the csv, that is it.
I know it seems tricky but if I do it manually EasyMorph can do. Don’t be mislead by the chart as you will not have one and see it. The levels (max and min) are my creation from the csv manually to facilitate the occurrences.
Now I knew and understood very well that I mislead you when we were doing the previous project.
Here will be a sample csv I will get every 4 days. Some corrections the high and low of the third day, was supposed to be 46 not 38. Every thing has to be calculated from this. Assume that you did not see the chart or the level of temperatures.
Dm2.csv (1.7 KB)
Let me give you the process to do it manually.
- Look and find the high and the Low of the 4 days (1 Max and 1 Min of all 4 days)
- Divide the high and the low into 4 equal levels 1, 2, 3, 4 (very hot, hot, mild, cold)
- Create the blocks of 4 days and 4 levels; 4x4=16
- Locate if the temperature was passing through the levels, if so write 1 in each block, else leave it empty.
- Add up the total 1s out of the 16 blocks where the temperature passes through calculated from the daily high and low
Look how I plot manually without seeing the chart which I don’t have in the first place.
- I arrive creating the levels at the bottom from the csv on top
- By looking into the two tables I arrive to plot the “1” if Temperature happened at any Level in time.
- I sum up and arrive at 13Dm3T.csv (2.2 KB)
Do you get the point now?
More clarifications:
You asked me about data set because you saw the chart, I know, that is why I did not want to show you the chart in the first place because you will focus on the zigzags of the chart. I have plotted for you in doted line the high and the low of the day which we see and get it from the csv high and low of the day data only. That is how I plot the total "1"s to a total of 13 I sent you, not from the chart but from the csv data only. Look how the dotted line touches 13 places of blocks. So forget the zigzags, forget even the chart if you can. Picture in your mind only the 4 doted lines of the 4 days.
Thank you Dmtry. This could be applicable for so many applications, so know that you are not only helping me but many others, believe me. Tell me if some one ask you when was very hot, hot, mild or cold (or all types of temperature in one day) just from the csv how would you do it. Imagine if some one gave you of a year data or even years. I can go and go on giving many examples.