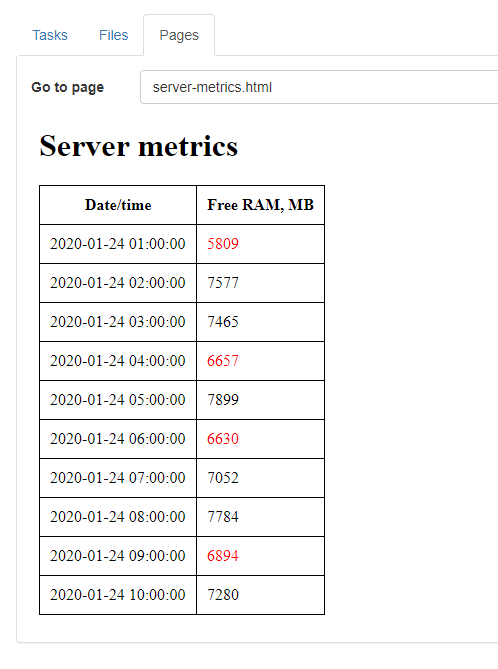
Here is a project which, when scheduled, collects information about free RAM and generates a simple HTML report published in Pages. This is what the final result looks like:
And the project itself:
server-metrics.morph (21.8 KB)
Here is how to set it up:
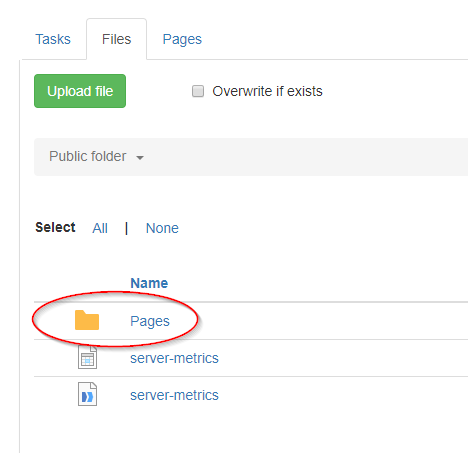
Step 1. Create a folder for Pages
Server Pages are described in the Admin Guide that comes with the Server installer. If you're not familiar with it - read the description of Pages in the Guide first.
Create a folder that will be used for hosting HTML pages. For instance, it can be a subfolder named "Pages" in the public folder of the Default space (configured in the space settings), as in the screenshot below.
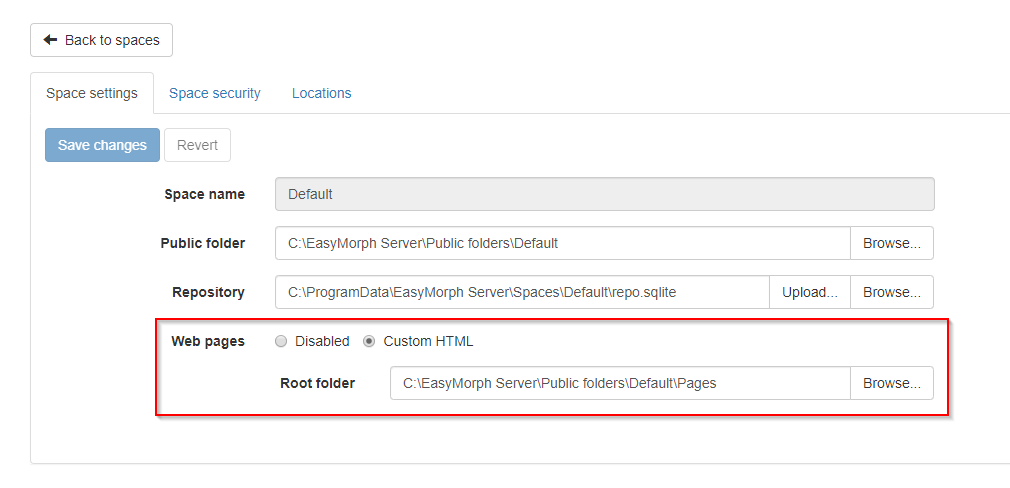
Step 2. Enable Pages
Pages are disabled by default. Enable Pages in the space where you're going to publish the generated HTML report with RAM usage.
You have to be logged in as administrator.
When enabled, provide the path of the folder that you created in Step 1 above.
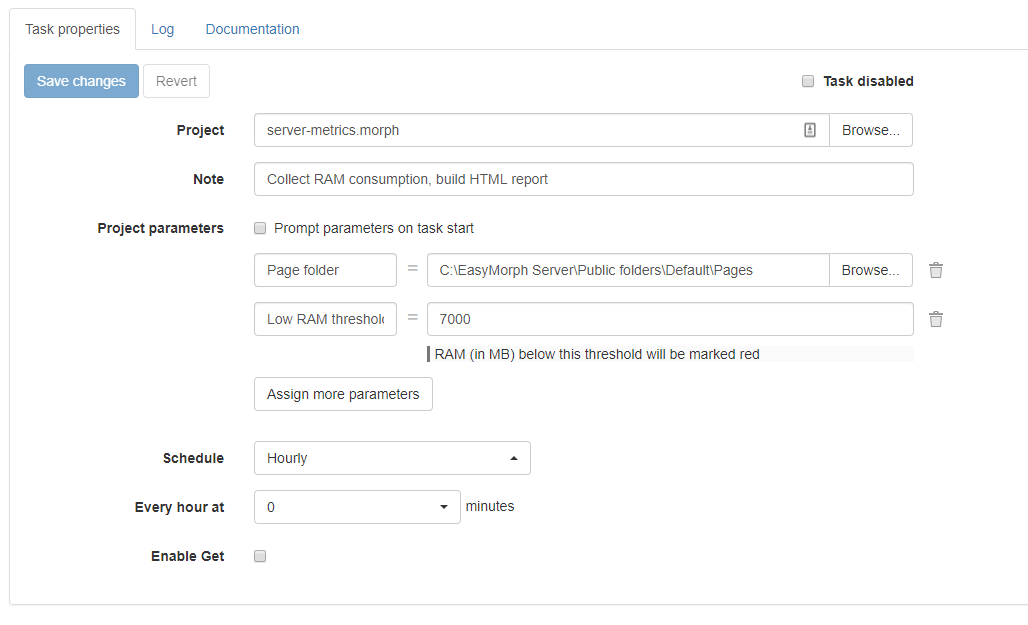
Step 3. Publish and schedule the project
Publish upload the project server-metrics.morph into the Public folder. Create a task with the following parameters:
- Page folder - the path to the Pages folder that you created in Step 1 above.
- Low RAM threshold - the level (in MB) below which the available RAM metric will appear red in the report.
Run the task manually once to make sure everything works correctly. Go to tab Pages. If everything is alright, you will see a report similar to the first screenshot in this post.
A few notes about the project logic:
- The project generates and updates server-metric.dset that contains measurements
- Only the 24 most recent memory measurements are kept, the older are discarded
- Metrics are aggregated, timestamps are rounded to 1-hour intervals in the report (but not in the .dset file)
- The project is designed to be modular. Additional metrics may be added with additional modules. I might be posting updated versions of the project with new modules for other metrics besides free RAM.
Feel free to customize the project logic. For instance, you can add an email notification in case free RAM falls below the threshold. Or publish the measurement dataset into Power BI or Tableau for a nicer visualization.
UPDATE 1/25/2020
The project is updated:
- Fixed bug with rolling window
- Report now shows measurements in the reverse order in order to show the most recent measurement first
- Improved rounding