As you may already know, EasyMorph can publish push-datasets and refresh regular datasets in Power BI using the built-in actions "Export to Power BI" and "Power BI Command," respectively. However, it is also possible to stream data from EasyMorph to the third type of datasets in Power BI - the streaming datasets.
Streaming datasets allow building dashboards that update in real time. Every time a streaming dataset is updated, any dashboard that is built on it refreshes automatically.
In this article, I will show how to build a real-time Power BI dashboard that updates in real time whenever EasyMorph pushes a new random number into its underlying streaming dataset.
Step 1: Create a streaming dataset in Power BI
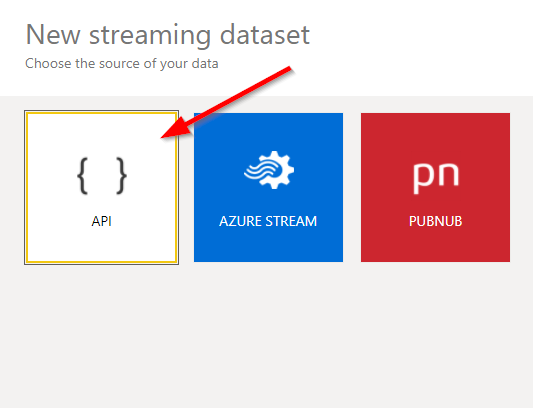
Go to My Workspace and create a new streaming dataset.

Pick "API" dataset.
In the dataset settings, specify:
- Dataset name (e.g. "Test streaming")
- Field "Timestamp" (type Date)
- Field "Random number" (type Number)
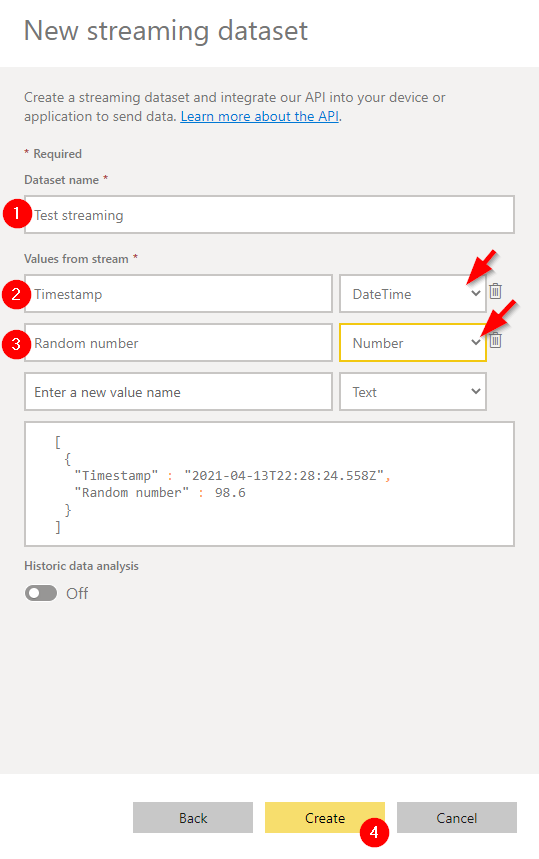
Notice that Power BI conveniently shows the JSON format it expects. Remember the date format for the timestamp. Notice also the wrapping square brackets that indicate a JSON array.
Here is the JSON format, in case you missed it:
[
  {
    "Timestamp" :"2021-04-13T22:59:29.220Z",
    "Random number" :98.6
  }
]
In the next screen, Power BI will generate a unique URL for the streaming dataset. This is a very important URL. Every time a JSON (in the format specified above) is sent to this URL, the streaming dataset updates.
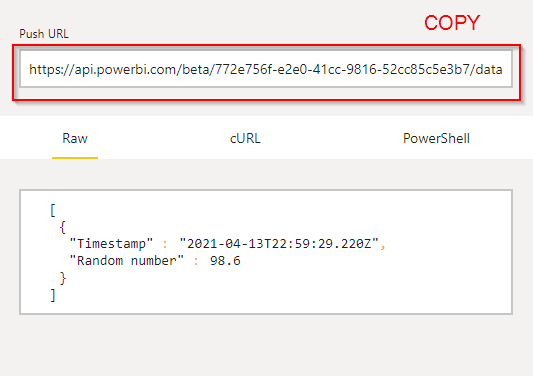
Here is a sample URL:
https://api.powerbi.com/beta/992e756f-e2e0-41cc-9816-52cc85c5e3b7/datasets/64b28d44-4219-438d-a105-c75f046ca8fb/rows?noSignUpCheck=1&key=rhY%2FbGskuskJVCFEiVafI0AeH0%2F5B5zLwxJ%2BvS18WWPFRo0rM2SJaIYvyQQp4tmfTwx7%2BCkSwaDFxxlzNydKsA%3D%3D
The URL is rather lengthy and has several components. Let's look closer at the components of this URL:
Base URL: https://api.powerbi.com/beta/992e756f-e2e0-41cc-9816-52cc85c5e3b7/datasets/64b28d44-4219-438d-a105-c75f046ca8fb/ points to Power BI's web API. The 1st GUID (the cryptic alphanumeric value) is probably my user ID. The second GUID is the dataset ID. Both GUIDs will be different in your case.
rows - that's an API endpoint.
noSignUpCheck=1 - a URL parameter.
key=rhY%2FbGskuskJVCFEiVafI0AeH0%2F5B5zLwxJ%2BvS18WWPFRo0rM2SJaIYvyQQp4tmfTwx7%2BCkSwaDFxxlzNydKsA%3D%3D - another URL parameter. Notice that Power BI provides the value of the parameter already URL-encoded.
Now we're all set to get things ready in EasyMorph.
Step 3: Configure connector, actions in EasyMorph
Since we're going to send JSONs to the web API, we will need a "Web Location" connector. Let's create one:
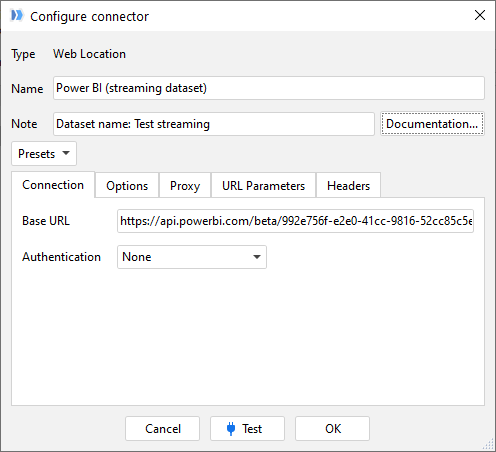
In the connector, we only need to provide the base URL without the "rows" part and everything that follows it.
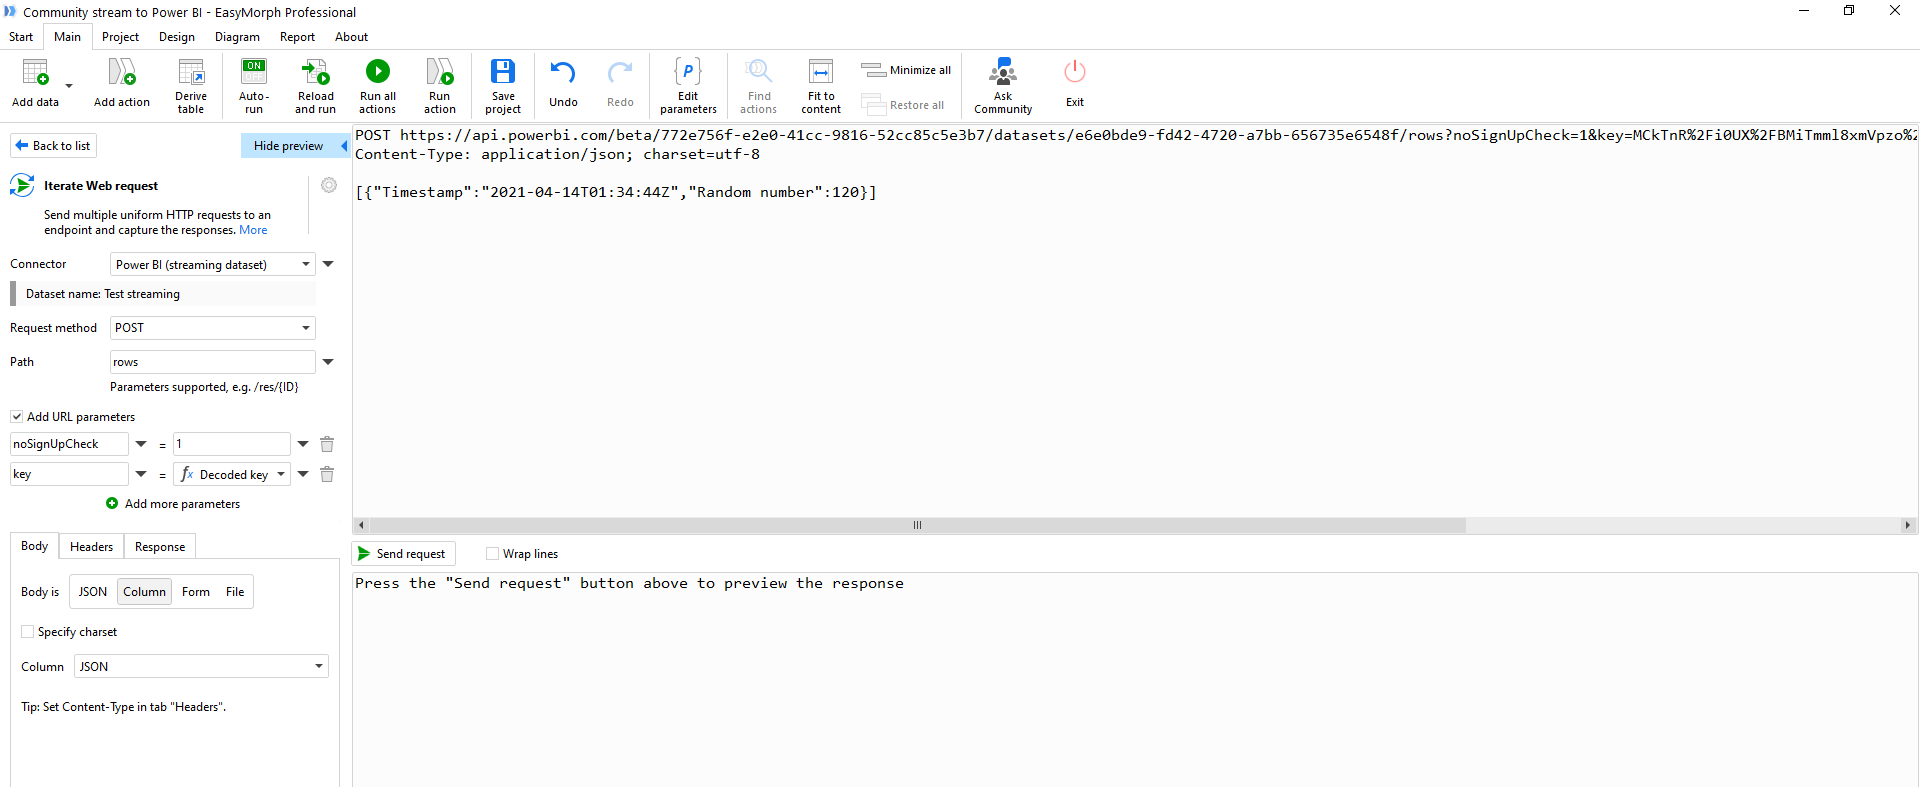
Now let's create a workflow. In this example, the workflow is a loop, that simply generates a random number, creates a JSON with the number, and sends it to the web API every second. The actual project is provided at the end of the article. The most interesting part of it is the "Iterate web request" action. It is configured as follows:
- Request method: POST
- Path: rows
- URL parameters:
- noSignUpCheck=1
- key = parameter "Decoded key" (more on that in a moment)
- Request body: Column "JSON" (calculated in the previous step, see the example project)
- Request headers (tab "Headers"):
- Header "Content-Type: application/json"
In the request preview, you can copy the final URL and make sure it exactly matches the URL provided by Power BI.
The reason we didn't provide the key as is as a URL parameter because, as you remember, Power BI provides in the URL encoded form. However, EasyMorph needs a regular value, not encoded. Therefore we need a calculated parameter to decode it first as follows:
decode("uriComponentEscape", {Key})
The Key parameter here contains the encoded key from the Power BI URL described in Step 2 above.
When we run the "Iterate web request" action, it should return status 200 OK which means that the JSON was successfully published into the streaming dataset.
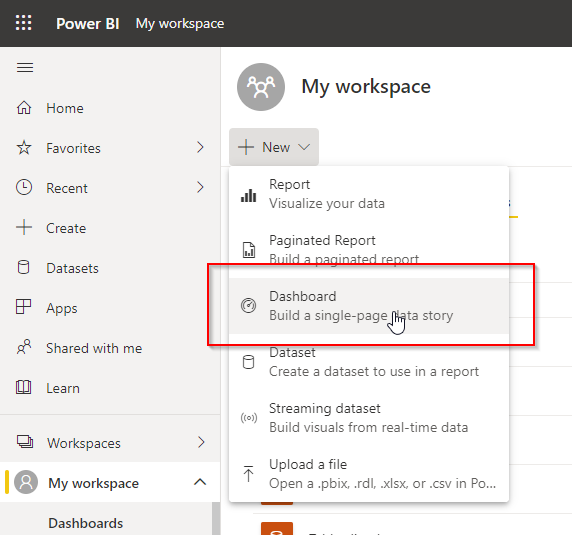
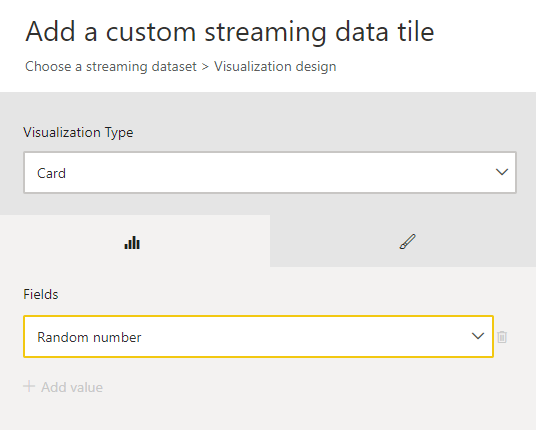
Step 4: Design a real-time dashboard in Power BI
Create a new Power BI dashboard:
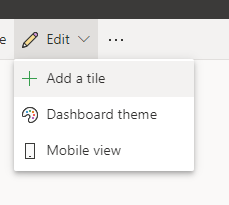
Add a tile:
Pick "Real-time streaming data" tile:
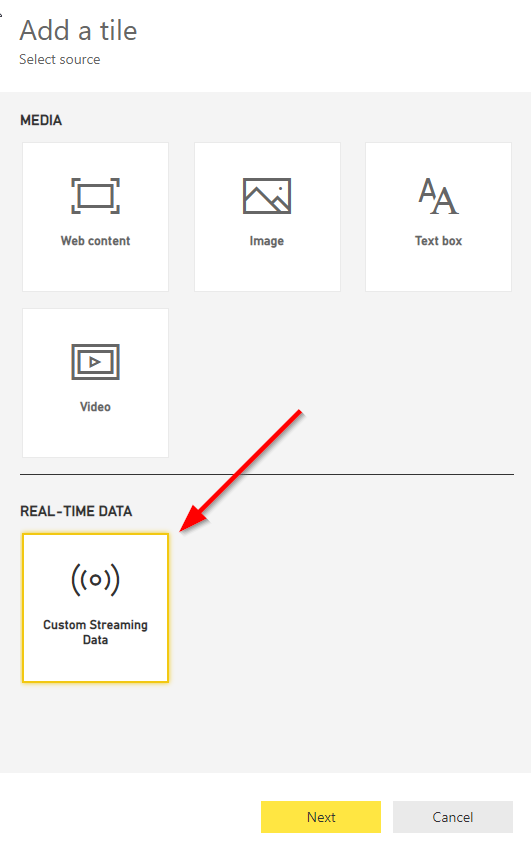
Select our streaming dataset created in Step 1 above, and add the field "Random data" from it to the tile.
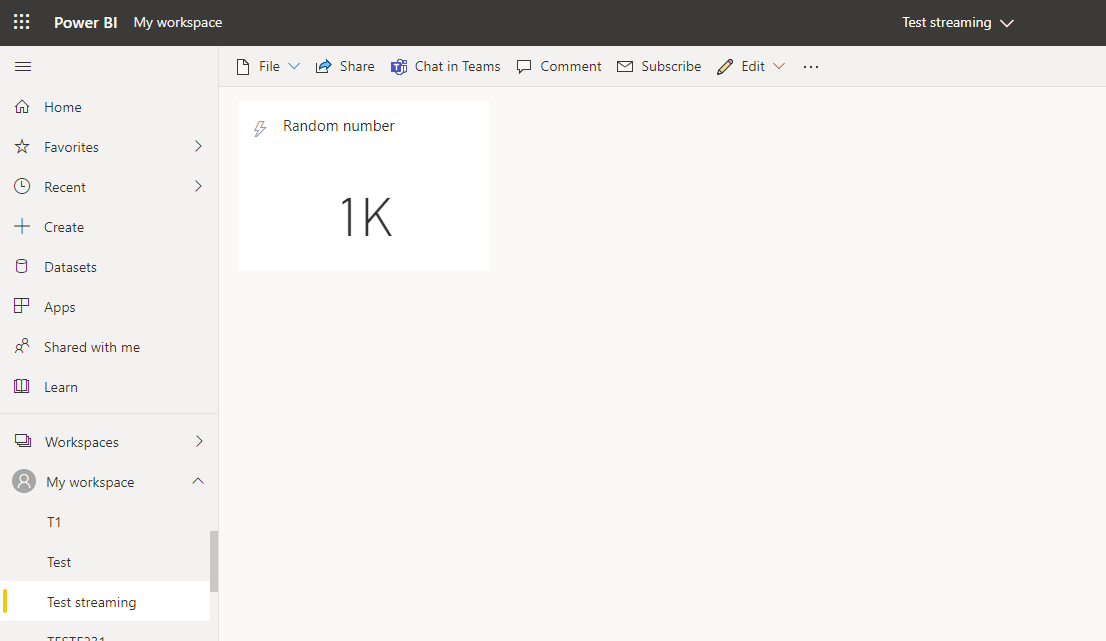
Here is a result:
Step 5: Publish data
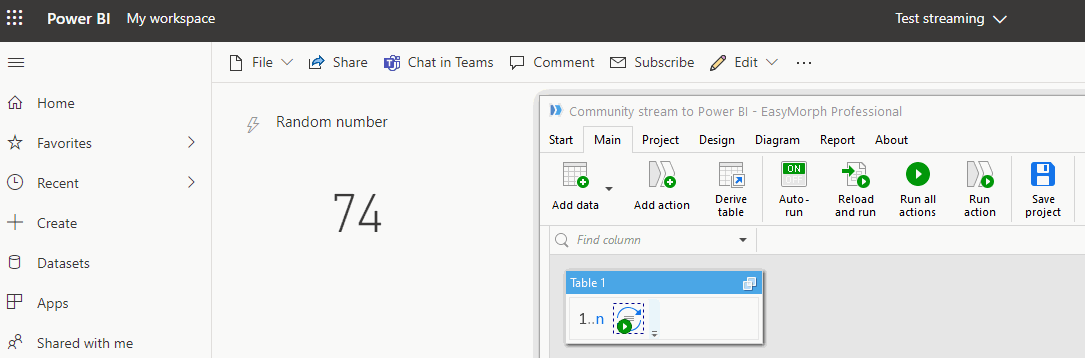
Now the fun part! Let's run the project and see how the dashboard is updated in real time. I've also inserted the "Status" action in the EasyMorph workflow so that you can see that the number in the status message is exactly the number displayed in the Power BI dashboard.
Here is what it looks like in action:
The project used in the demo is below. To use the project, configure its "Web location" connector, and update the 'key' parameter value.
Stream to Power BI.morph (9.8 KB)