Here is a quick guide to help you get started with boards in EasyMorph until we add a proper article on Explorer boards to our tutorial.
Boards can be created and viewed in Desktop and Server in version 5.7 or above. They are part of Explorer (which supersedes the Catalog). Explorer is available in one space, usually the Default space, in Team and Enterprise editions of EasyMorph Server. So anyone who has EasyMorph Server (except the Basic edition) can design boards.
Let's start with the Server:
Where can I find Explorer in EasyMorph Server?
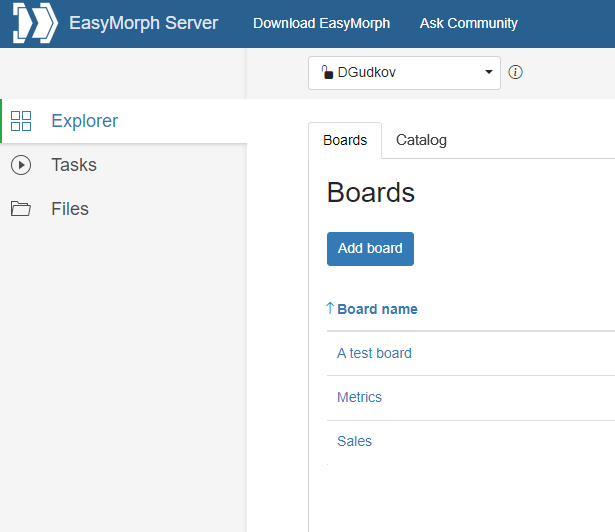
Explorer is in the first tab in the sidebar.
It used to be the Catalog tab, but it was renamed to Explorer when we added boards. The Catalog is now part of Explorer.
If you don't see the Explorer tab in the sidebar menu, it means one of the following:
- Your EasyMorph Server edition is Basic. The Basic edition doesn't have Explorer. The Team and Enterprise editions do.
- You are in a space in which Explorer is not enabled. To enable Explorer, go to the space settings, tab "Features", and enable the "Explorer" feature. Note that without the Explorer Add-on, Explorer is only available in one space. Usually, it's the Default space.
If you would like to have Explorer in another space, disable it in the Default space and enable it in another space.
What is a board?
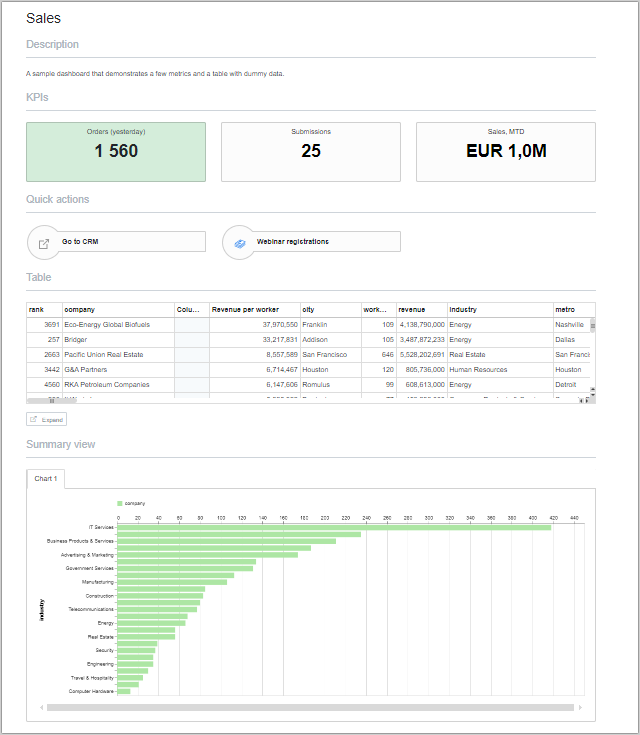
Boards are a data exploration and collaboration tool that can be used to monitor and manage a business or technical process. They combine and unify important information from different systems, provide automation, centralize links to data in different locations, and serve as starting points for your data exploration.
Here is an example of a board (with dummy data)
Boards can be used in various ways in non-technical and IT departments:
- Unify your important business or technical information in one view
- Deliver workflow computation results (datasets, files) to employees in your organization
- Explore and analyze tabular data in your business applications and databases
- Collect and track metrics
- Build simple dashboards
- Trigger automation workflows
In the next major version (5.8), boards in EasyMorph will be able to operate with issues – a major work management and automation capability that will enable a whole range of new and exciting use cases for EasyMorph, such as approval workflows, work automation, incident management, and many more.
Boards are designed to be low-ceremony -- they are easy to create and have a uniform look.
Creating boards
Once you have found Explorer, you can create your first board. Just press the "Add board" button (which can be seen in the screenshot above).
Note that a board can be displayed in one of two modes:
- Viewing mode
- Editing mode
When you create a new board from scratch, you see it in the editing mode. To exit the editing mode, press "Done editing":
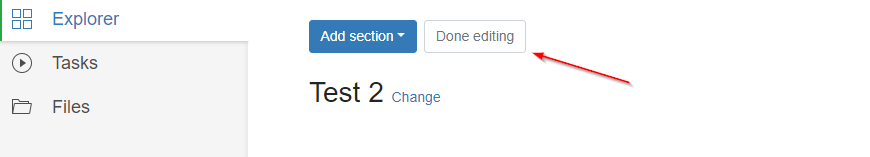
Boards consist of vertically stacked sections of different types. To add a section, press the "Add section button" (can be seen in the screenshot above) while in editing mode.
The available section types include:
- Metrics
- Tables
- Charts
- Asset shortcuts
- Text
Any section has a title, settings, and position in the board. To edit section settings, click the cogwheel icon. To move the section up or down in the board, click the respective arrows.

(shown in the editing mode)
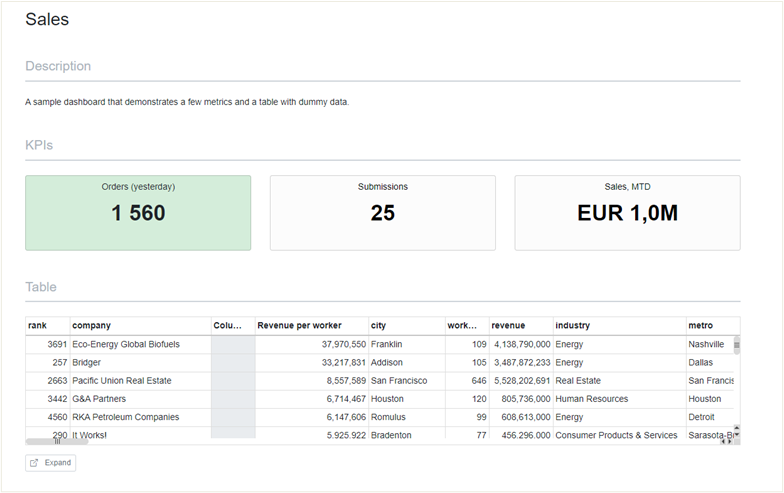
A board can have any number of sections of any type in any order. Here is an example of a board with 3 sections:
Board sections can be configured using Catalog assets. If you're not familiar with the Catalog in EasyMorph, this is not a problem -- all section types can be configured without using Catalog assets at all. Once you learn more about Explorer, you may want to start using Catalog assets as they provide reusability and more advanced functionality.
Let's look closer at the section types:
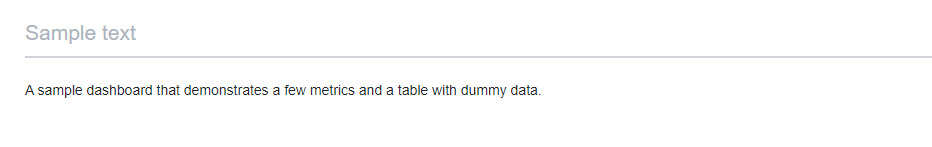
Section: Text
This is the simplest section type. Its only setting is the text to display.
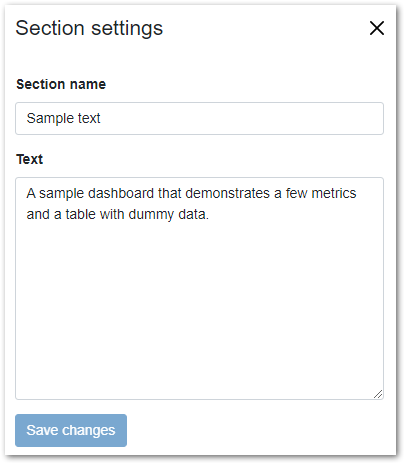
The text appears as plain text with no formatting. You can use this section, for instance, to provide a brief introduction to the board, or to post the latest updates related to the information in the board.
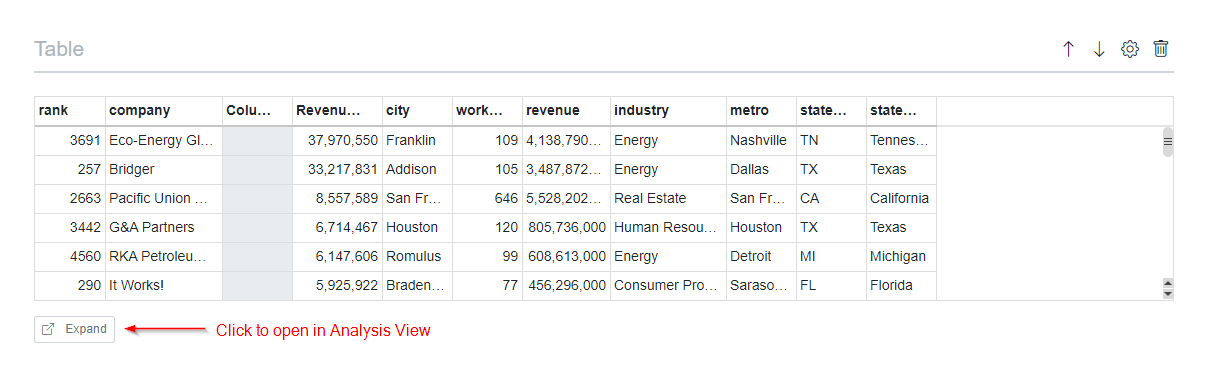
Section: Table
In this section type, specify a path to a .dset file stored on the Server (in the same space). Alternatively, specify a static dataset from the Catalog.
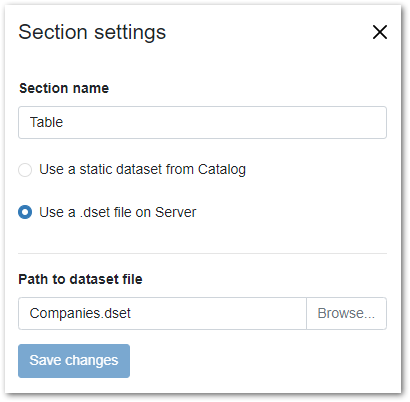
The contents of the selected .dset file will appear in the section.
Section: Metrics
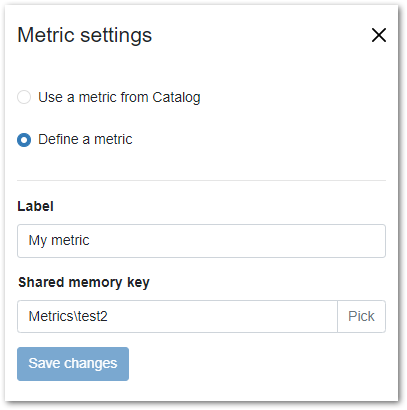
This section can display up to 6 metrics. A metric is basically a numeric value from Shared Memory with a label. To configure a new metric in this section, click an empty slot and configure a metric as shown below:
If the specified key doesn't exist in Shared Memory yet, you will see this error message:
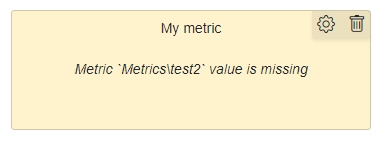
To set a Shared Memory value, use the "Shared memory" action in a workflow.
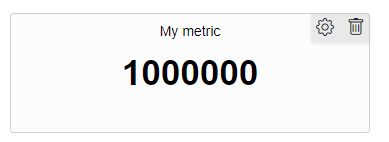
When configured properly, a metric immediately appears in the section.
Alternatively, create a metric in the Catalog and use it in the section. Values of metrics from the Catalog can be updated manually right in the metric settings in the Catalog, or using the "Catalog command" action, the "Set metric value" command.
Also, when metrics from the Catalog are edited in Desktop, you can additionally specify formatting and good/bad ranges. In future versions, these additional metric settings will be available in the web UI as well.
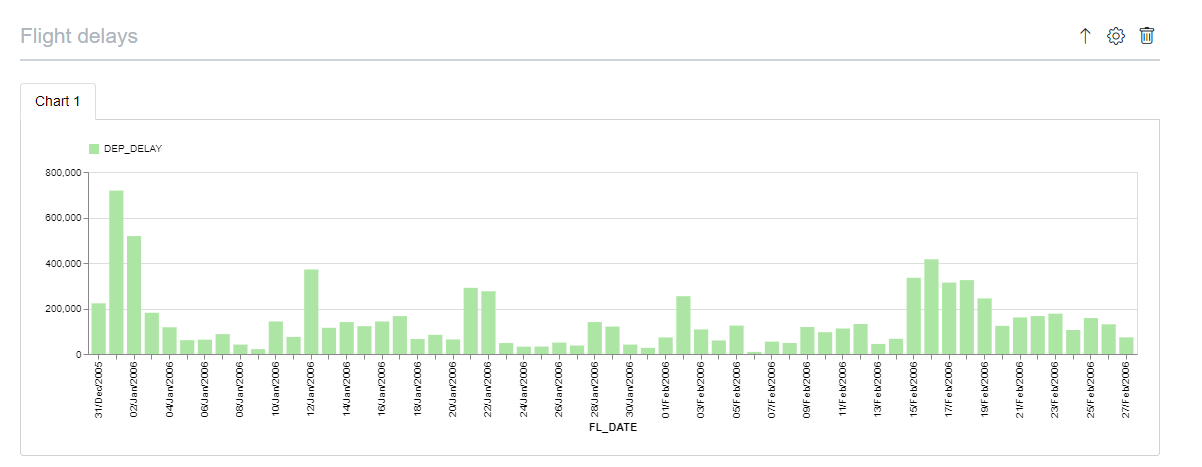
Section: Charts
This section displays one or more charts from the Analysis View of the specified .dset file (or static dataset from the Catalog).
This part can be a little unobvious, so I'll go into more details here:
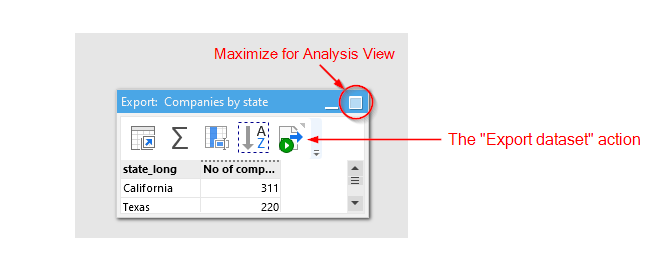
Every time you generate a .dset file using the "Export dataset" action, EasyMorph also writes the Analysis View of the table that contains the action. This includes all the charts created in the Analysis View. Therefore, to configure a chart in a .dset file, go to the Analysis View of the table that contains the action and configure the chart(s) there. Don't forget to save the project.
In the "Chart" section, it is also possible to use a static dataset from the Catalog. In this case, the Analysis View of the Catalog asset will take precedence over the Analysis View of the dataset specified in the asset settings.
Currently, the Analysis View of static datasets in the Catalog can only be edited and updated in EasyMorph Desktop (see this tutorial article, section "Advanced topics")
After you configure the chart section, the charts will appear in the section.
Section: Asset shortcuts
This section type contains up to 6 links to web pages or Catalog assets (except metrics). They are shown as clickable buttons.
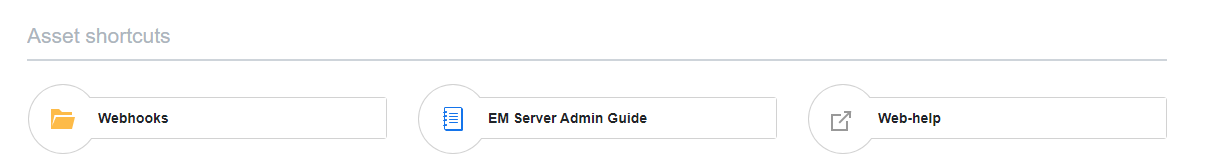
Web links are just URLs of web pages.
A link to a Catalog asset, when clicked, invokes the asset -- calculates a computed dataset, downloads a file, runs a workflow, opens a folder, etc.