We're revamping the Catalog. It will become part of a new feature called Explorer, available in both Server and Desktop. In a nutshell, Explorer is a tool for data exploration and work management.
What's data exploration?
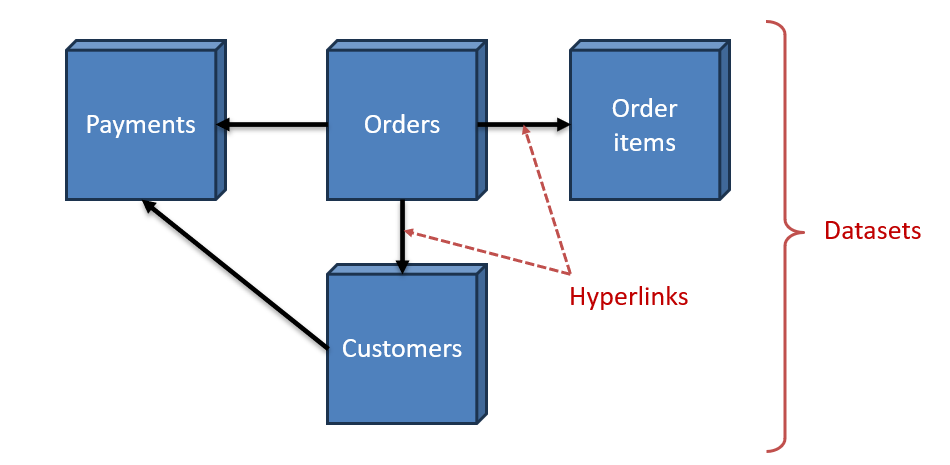
EasyMorph creates a unified linked view of your business data, such as orders, customers, payments, inventory, products, employees, transactions, etc. This view is composed of datasets that can be pre-calculated (as .dset files) or calculated on the fly (using .morph workflows). I call it "web of data". It's like internet, but instead of hyperlinked web-pages, you browse hyperlinked datasets with your business data.
These datasets:
- Can be pre-computed (.dset) or computed on demand (.morph) from any data source supported by EasyMorph
- Have pre-configured Analysis View (filters and charts)
- Hyperlinked: one-click transition from one dataset to another (e.g. from a particular order to a list of items in this order)
- Small automation (actions triggered in one click, e.g. canceling an order, or sending a notification, or creating an issue, or updating a database record)
See the video below to get an idea how it works:
What's the benefit of data exploration?
In most organizations, business data is fragmented across multiple business systems - CRM, ERP, Accounting, E-commerce, HR, legacy applications, custom apps, etc. These systems usually have little integration, if any. There is a frequent need to view related data in another system or reconcile/merge data from different systems, but because systems aren't integrated, that's not possible or cumbersome because it requires switching apps and contexts. Previously, it was thought that this problem could be overcome using data warehouses that would import data from all business systems and consolidate it in one (materialized) data model, but they turned out to be very expensive, extremely difficult to build and maintain, and still containing incomplete and outdated data.
The Explorer is, technically speaking, a data virtualization technology that allows creating a unified real-time view of business data distributed across many business applications and letting the business user navigate the view from a single standard UI.
The technology isn't new and has been in EasyMorph for a while, branded as "Catalog".
What about the Catalog?
We introduced the Catalog about a year ago. The idea of data exploration on which the Catalog was based still makes sense, but the implementation wasn't right and saw limited adoption. The Catalog was confusing, had a steep learning curve, and had a complex licensing model. Also, it was fully available only in Desktops.
Now, we're re-implementing the concept of data exploration by introducing Explorer which supersedes but also includes the Catalog. What's changing:
-
Explorer is a first-class citizen in the Server's UI. So you will be able to browse datasets (pre-computed or computed on the fly), view them, analyze them, and filter right from a web browser. BTW, it will work in web browsers extremely fast, even with large datasets with hundreds of millions of datapoints - as fast as if you used Desktop and even faster. Expect instant UI responses without any network delays.
The promise of staying in the flow state remains even if you work in browser.
-
EasyMorph Server is not mandatory for Explorer. You will be able to construct views, link datasets, and navigate them even with a single Desktop license. If your Desktop is connected to EasyMorph Server, then you will also be able to browse Catalog assets and boards from the same Explorer view.
If you upgrade to a Sever version later, your views can be ported to EasyMorph Server without any extra effort, just by copying your .morph and .dset files to the Server.
-
The Catalog app in Desktop will be replaced with the Explorer app
As a bonus point, the Explorer will support CSViewer views (.csview files).
What about the work management part?
To reiterate, Explorer is intended for data exploration and work management. The data exploration part was outlined above. The work management part (with elements of data visualization) will be implemented in the form of boards, announced earlier: 💡 Announcement: Boards
Boards are tightly coupled with the data exploration story as they can serve as the starting point for a data exploration journey. For instance, if you have an accounting board, in one click you can navigate from that board into a related dataset (e.g. transactions).
Enhanced Business Intelligence
When viewed from another perspective, the Explorer will offer what I call enhanced Business Intelligence - that is data analytics (quantitative information) enhanced with qualitative information (in the form of issues in boards) and automation. That's why you will eventually see in Explorer the ability to embed and link Tableau and Power BI dashboards into the web of data constructed with Explorer. They are important assets of your organization and need to be part of the unified view. Luckily, both BI platforms provide good embedding APIs with the ability to dynamically apply filters which is necessary for convenient hyperlinking.
On a personal note, I've been long contemplating how can we re-think Business Intelligence similarly to how we re-thought ETL, and it seems like we now have a fresh idea for BI too.
What about licensing?
The licensing model remains pretty much the same - the Catalog Add-on will be renamed to Explorer Add-on and will permit unlimited users in unlimited spaces. The price won't change. Without the add-on, the Explorer (with the Catalog and the boards) will still be available in one space in the Team and Enterprise editions of EasyMorph Server.
When?
The initial version of Explorer will appear in EasyMorph in v5.7 (Jan 2024) but only part of its functionality will be available in that release. The full functionality will become available in v5.8 planned for March 2024.


