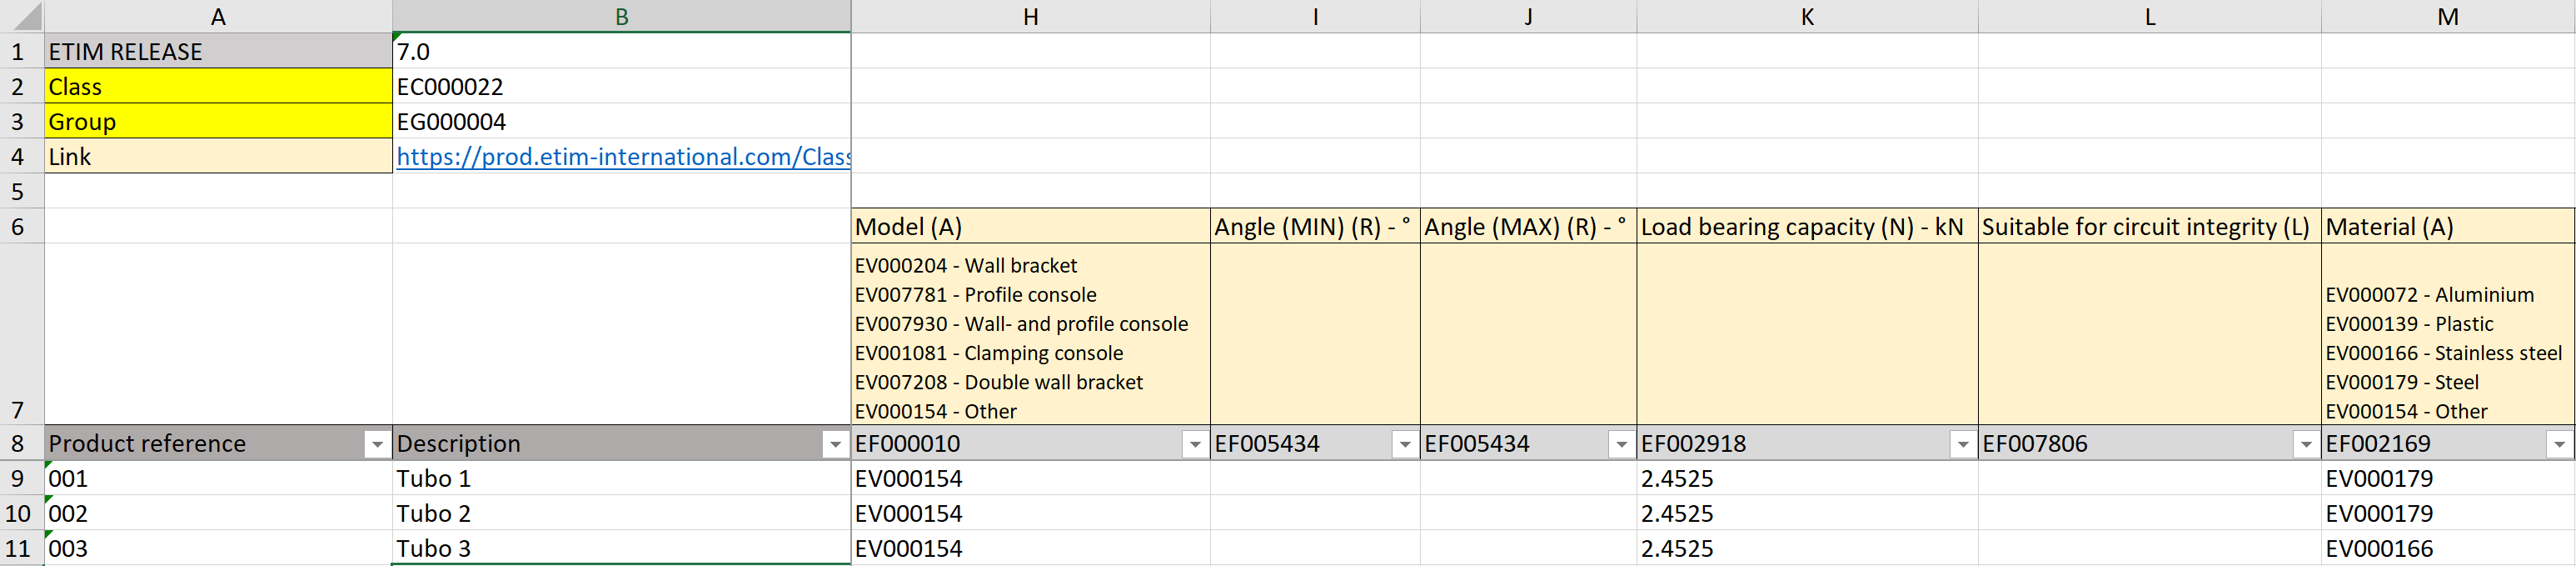
In a table I want to be able to create automatically, I have some rows which are informative, which give more info about the column headers. Until now I was doing it in excel and here I could include two informative rows (rows 6 and 7) above Row 8, where the table actually starts and the column headers are placed (where there’s the filter arrows). Rows 6 and 7 have formulas and their content changes depending on the value set in row 8 of the same column. Here is a screenshot of the excel file:
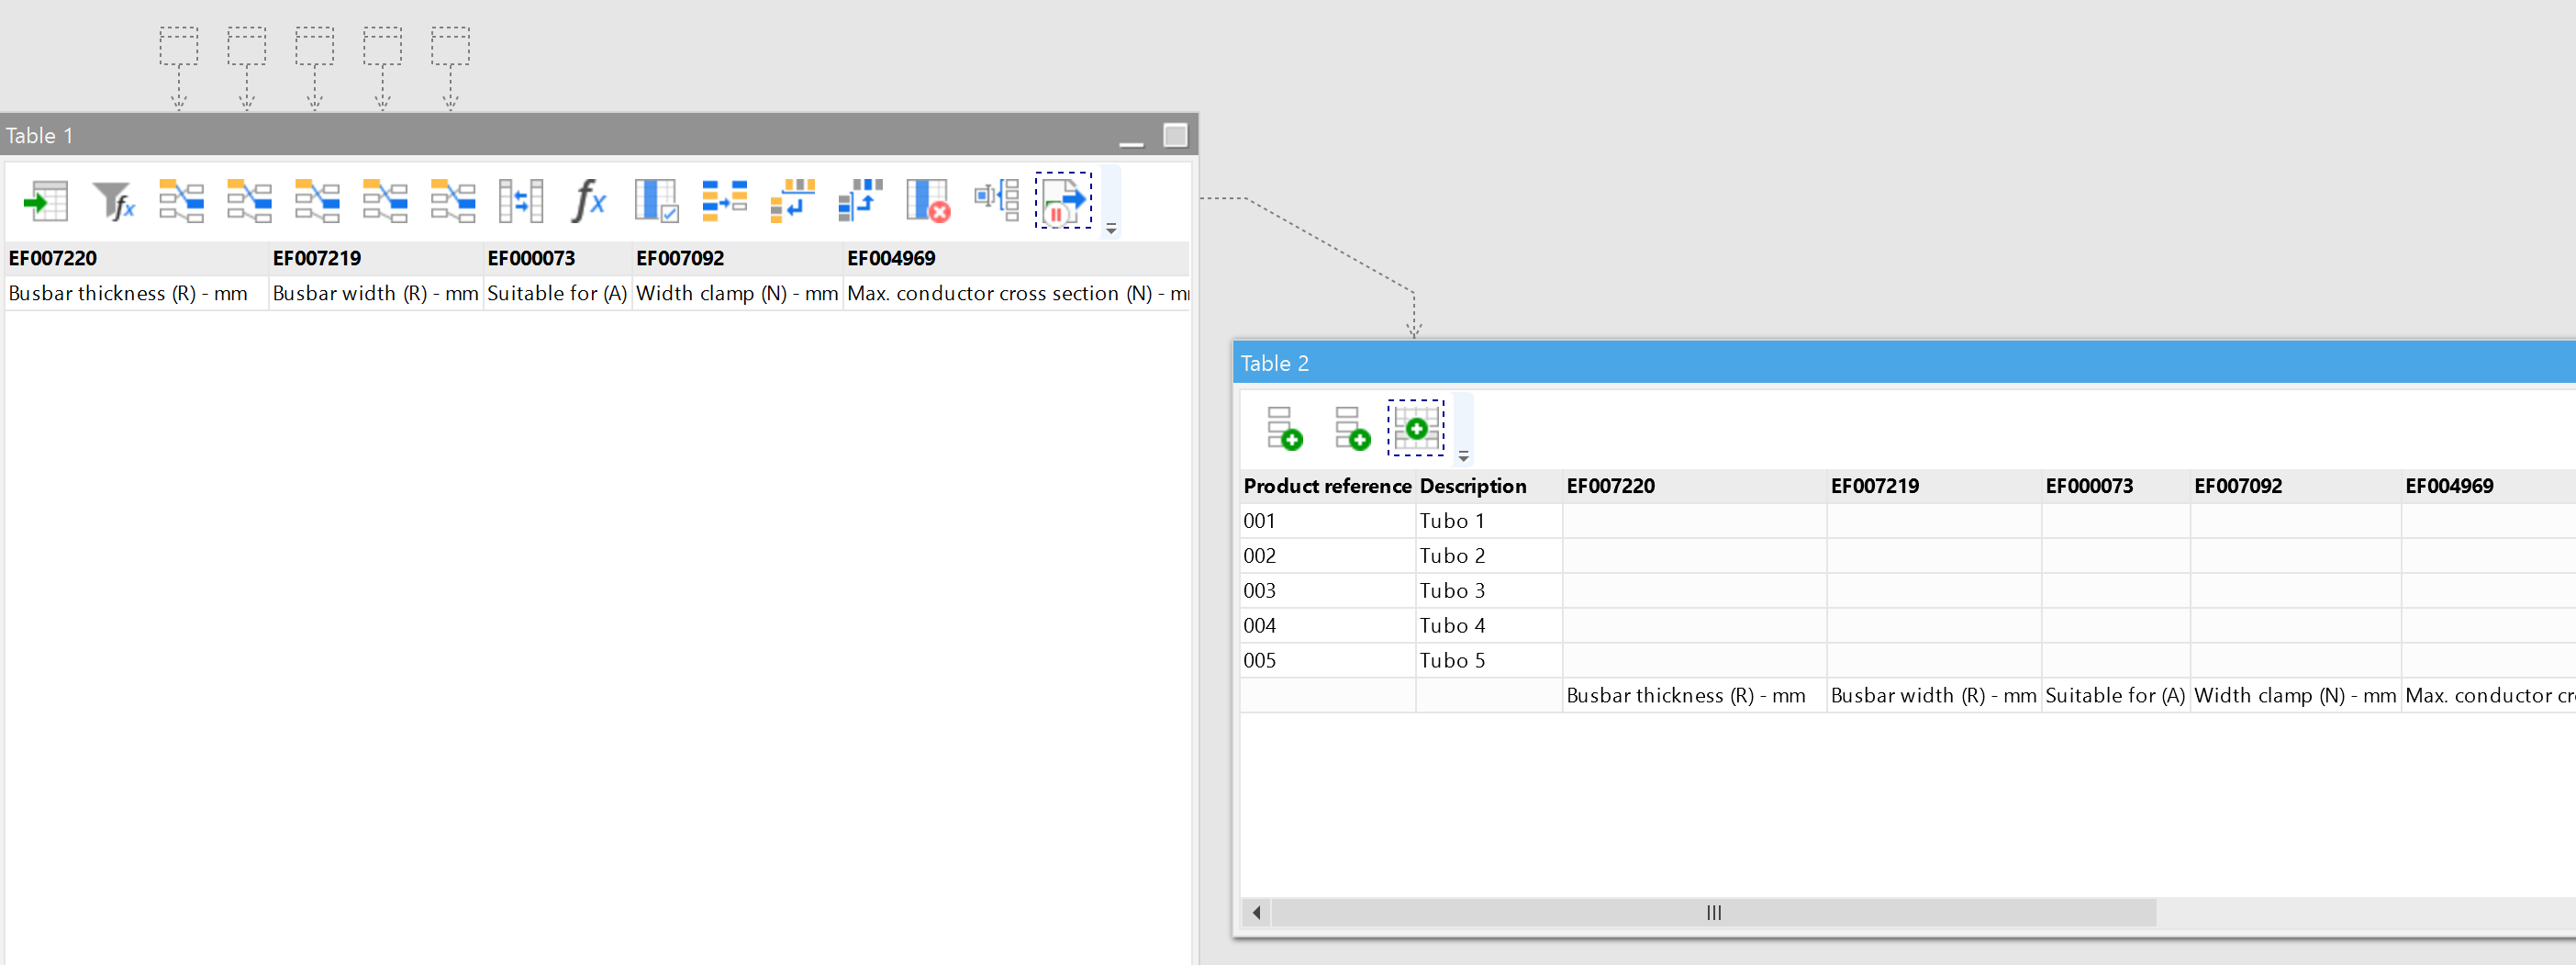
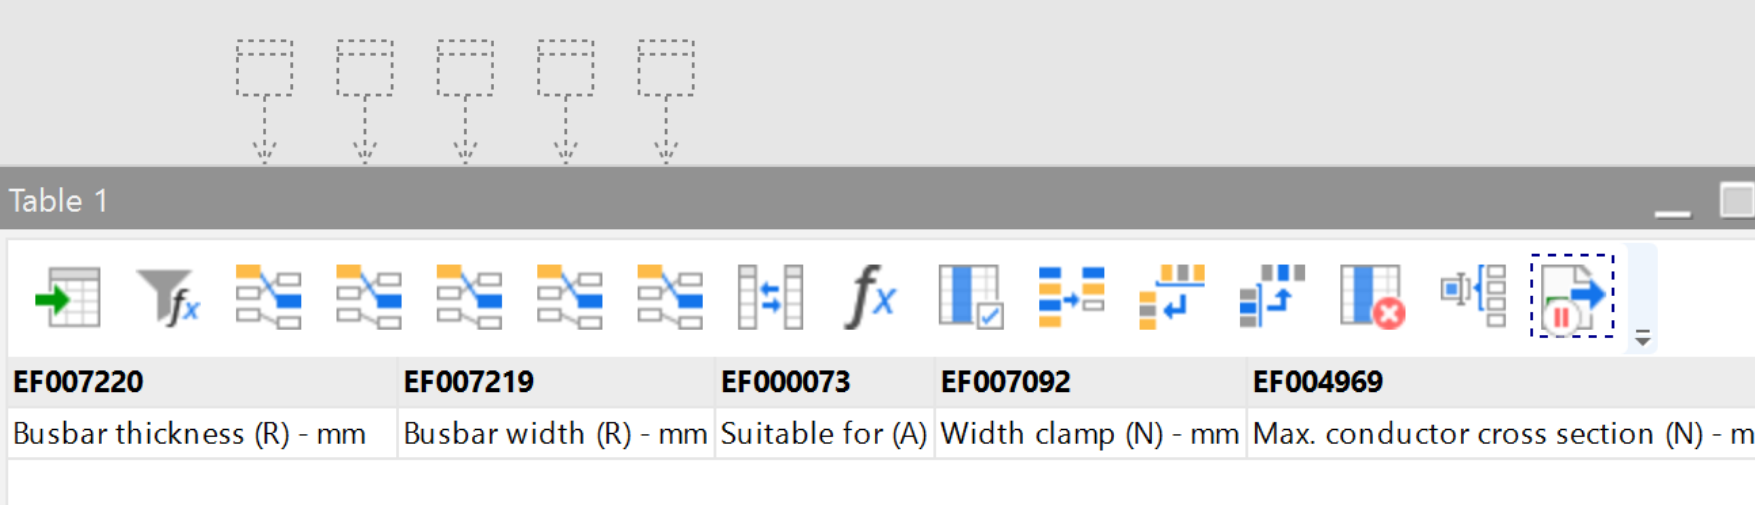
I have been able to replicate row 6 with EasyMorph. However, it appears below the column headers, and that becomes a problem when I join this table with the table that includes the product reference & description:
Going back to the first screenshot, I also want to add another row (row 7), which has additional information about the header below, and there is also some info in rows 1-4, which I also want to automate, and row 5 is empty.
So my question here is - if I want to add aditional info to a table, be it related directly with the table headers (rows 6 and 7), or not related with the table headers (rows 1-4), is this possible?
Finally, is it possible to give a format to certain cells (colors, bold, etc.) so that it appears when the resulting excel file is opened?
Data that is related to the whole table can be added as columns with a constant value in all rows.
Rich formatting not supported in EasyMorph. If you need a richly formatted Excel report, have a page in it with unformatted raw data, updated by EasyMorph. Then create another page with formatted representation of that data using formulas or pivot tables.
Thanks for your answer. The data that I want to include is not related to the whole table, but rather to each column. Maybe I didn't give accurate information before: I forgot to mention that the resulting table that you see here is actually the transposed result of the same table. Before transposing is where you can find all the actions that are done to obtain these descriptions. "Busbar thickness [R] - mm" is the description of column header EF007220, and "Busbar width [R] - mm" is the description of column header EF007219, and this has been obtained before transposing.
The fact that these descriptions are built inside Easymorph through actions is much, much better than the endless Excel formulas I had before. However, these descriptions are not properly rows of the table, they are not actual values, but they are calculated based on what is now the column header (after transposing).
So I really like the way I'm obtaining these descriptions now, but I don't know how I can replicate what I have in my original excel sheet (see screenshot above), where row 6 is calculated for each column but is not part of the actual table, which starts in row 8. Do you know what I mean? I have generated the descriptions I wanted, but I don't know where to put them, as they are not part of the table that has to be populated in the future.
Please let me know if there's something that is not clear.
The attached project differs from shown on the screenshot. Changes start from Step 10 which is an “Aggregate” action.
What you describe is column metadata. If you need to have it around, but not mix with the actual data, I would recommend keeping it in a separate table.
For instance, it can be a 2-column table, in which the 1st column are the names of column in the main table, and in the 2nd column - their descriptions. Such table can be pivoted and appended, before export, if necessary.
Sorry, I didn’t have in mind that I had modified the project! I deleted that attachment. In any case, I understand what you mean. Yes, “column metadata” would be the correct word
So appending the pivoted column metadata at export would append them below the actual values of the table, right? If I want to place this metadata above the column headers, as in my excel example, I would have to do this outside EasyMorph, for example in Excel itself?
In any of these two cases, the column metadata will always appear below the column headers. And below the column headers only the values of the table should appear (not the metadata + values below). Because from the resulting table that I export to excel, when I create a filter beginning in the column headers, the filter will include the column metadata apart from the values, as it is found below the column headers. The filter should not include the column metadata, only the values. That’s why in the excel screenshot in the opening post, the two rows of column metadata (rows 6 and 7) are placed above the column headers (row 8), so that below these only the values appear (and only the values appear in the filter, which is correct). That’s why it’s important for me to have the metadata above the column header, although I understand that it could sound illogical from a “table” point of view.
In any case, if I wanted to place this metadata above the column header, could I do it in EasyMorph, or would I have to do it manually in excel afterwards?
A column header is the topmost. Nothing can be placed above the column header. You can try making column metadata the column headers (pushing normal headers 1 row down ), and export like that, but that would require having unique column metadata for all columns, and not having empty ones.