Hello,
I have some new features that are not working.
Version used :

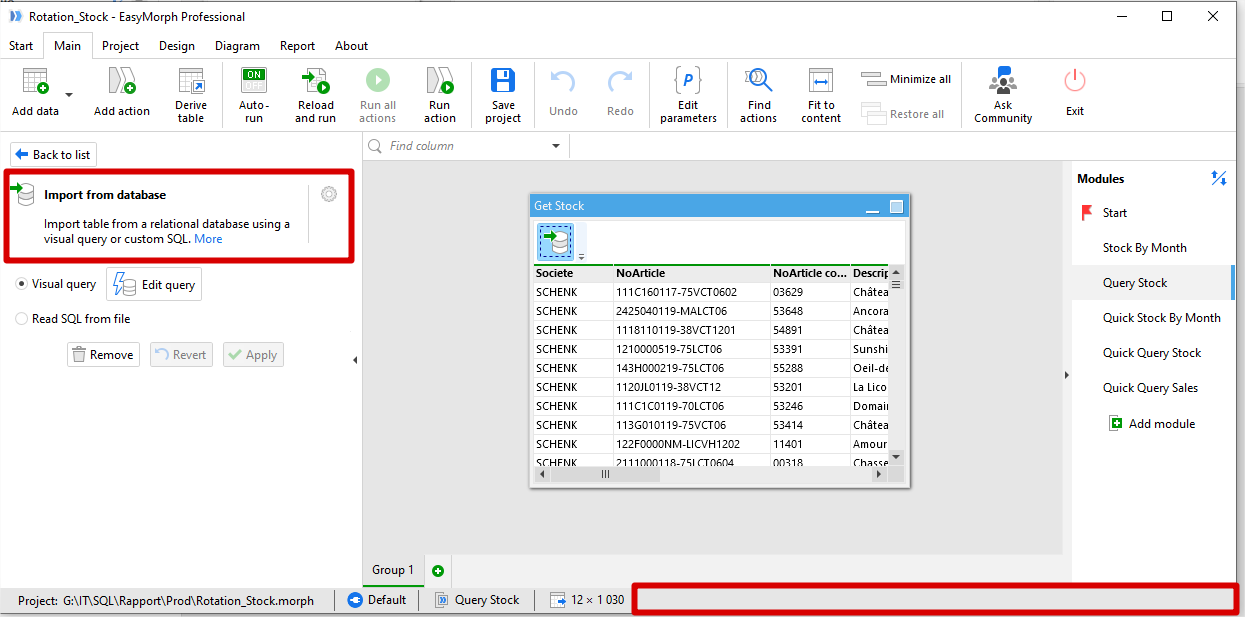
Where is “table context menu”? I don’t see clearly what it is.
Thanks.
Hello Florent,
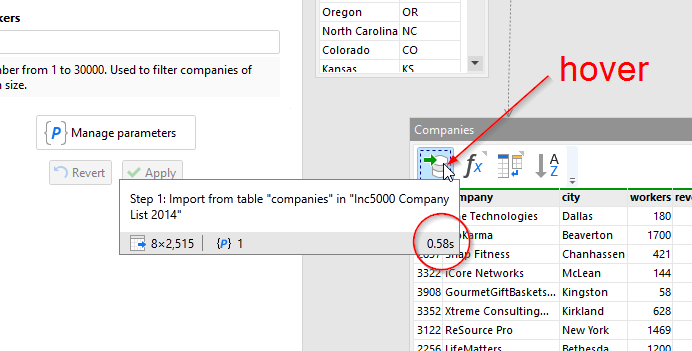
The elapsed time is shown in the action tooltip that opens when you hover an action, see below:
The table tooltip is shown in the Diagram view.
We disabled the feature at the last moment because it wasn't sufficiently tested. It will be enabled in 4.7.1.
I had never seen this tooltips. I have never stayed long enough in an action without moving the mouse.
That works well.
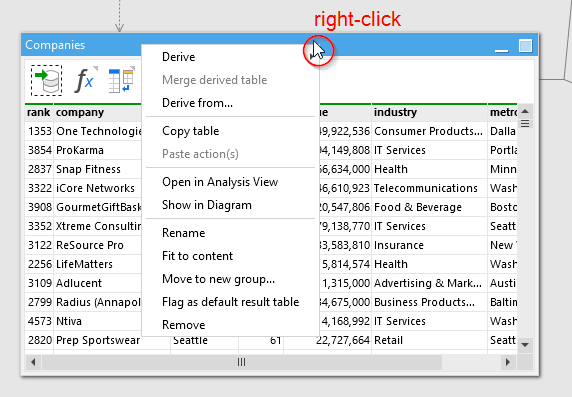
Missed this question. The table context menu opens when you right-click the table's title bar.
ok, it’s only a shortcut.
From my point of view, “open in analysis view” is already present with icon “maximize” with single click.
Yes, it does. We’ve added the command because it also exists in the Diagram, where the table context menu is the only way to jump to the Analysis View. So we’ve unified UI some menu commands in the regular view and in the Diagram.
For now, the few users I have just go to the EasyMorph server and run the tasks by specifying parameters.
They are not yet asking to go to the Morph files. Instead, they tell me, “how is it possible to have the result in 3s with EasyMorph while JET report takes 30 minutes to output the same data?”.
1 Like