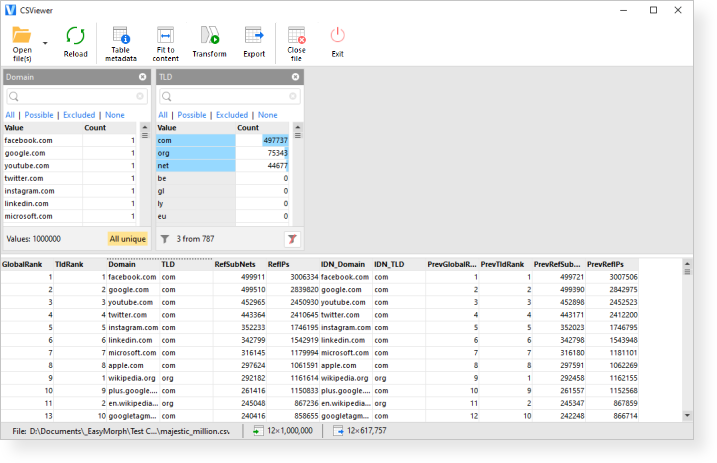
🎁 Meet CSViewer - a new tool from EasyMorph

We’re launching a new product. It’s called CSViewer. CSViewer a light-weight viewing/analysis tool for CSV files (and other delimited types of files – PSV, TSV, etc.). Here is what it looks like:


CSViewer has 4 main features:

1) View contents of CSV files

That part is simple: load one CSV file, or a collection of files, and view/analyze the contents. Loading a collection of files is a rare feature among similar tools, but it’s very useful for dealing with regularly generated data extracts.

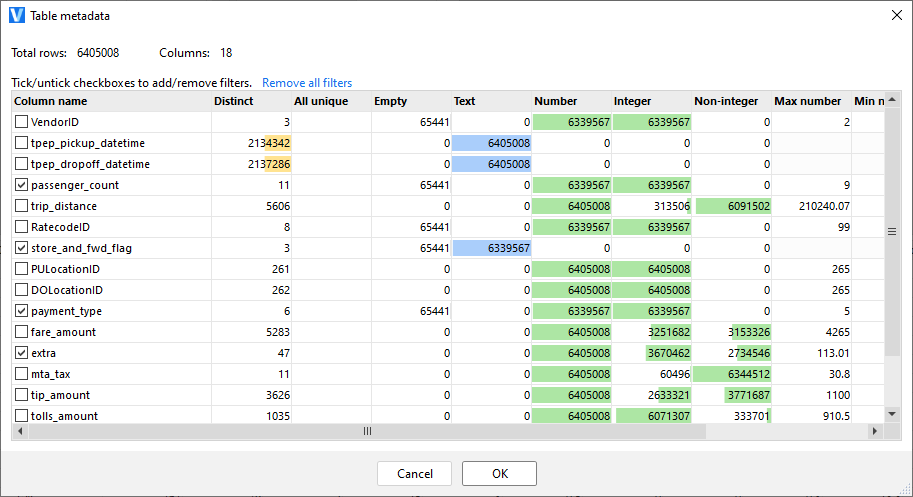
2) Profile CSV files

The “Table metadata” window provides full-table profiling information for every column in a single view: various counts, min/max numbers, min/max text lengths, etc.

3) Query/analyze CSV files

Here it gets a bit more interesting. We’ve implemented so called associative filtering which was pioneered by Qlik many years ago. Associative filtering is extremely good for analyzing relationships in data:

  • When an item is selected, it’s easy to see all the associated entities. For instance, when a product ID is selected, you can instantly see in which cities/regions there are orders for the product (assuming this data is present in the table)
  • You can see not only what’s included, but also what’s excluded. So you can immediately see in which cities/regions the product is NOT selling.
  • Free-path drill-down: start analyzing from any field and drill down by any field. No pre-defined drill-down paths required.

As per the initial release, querying is limited to only filtering. Later we will add additional querying/filtering/visualization features.

4) Export filtered data

Once you have a subset of data filtered it can be exported into a CSV file, or into EasyMorph (with all the filters applied).

Who CSViewer is for?

CSViewer is intended for people who frequently need to find something in CSV files. We see it as a lightweight data retrieval/analysis tool. It’s perfectly suitable for non-technical users that need an easy tool to find something in large tables that can’t be loaded in Excel.

What’s next

This is the initial release of CSViewer. Some things are not polished yet, so probably certain elements and features will be changing over the next few weeks or even months. Loading files isn’t as fast as we would want it to be, so some load optimizations will be introduced soon.

CSViewer is based on the EasyMorph technology, therefore certain elements of it may appear in CSViewer soon. For instance, we definitely want to add a dynamic chart that will visualize filtered data. Support for .xlsx and .dset files is not improbable either.

And the other way around, certain features of CSViewer will appear in EasyMorph. For instance, full-table profiling, associating filtering will appear in the maximized table view by the end of this year.

CSViewer will remain free forever. It comprises a few components of EasyMorph re-packaged so maintaining it is a relatively low effort for us.

Any other suggestions or questions about CSViewer? First impressions to share? Please make yourself heard in the comments below.

Thank you!

5 Likes

Hi Dmitry,

Thanks for sharing this tool !

I think this tool could be useful scanning CSV-files on their quality in an early stage of an ETL-project so that we can see what to expect.

Not sure I understand the following options in the filters. What dio they do exactly?

image

If we could filter the data from within the profiling window e.g. by double clicking on a data type field (when we see that there is more than 1 data type for a field) could be useful.

For example for field NISCODE, if we could double click on the value 1123 under TEXT data type to filter them directly, that could be useful.

This is exactly what we're going to do! Almost all numbers in table metadata will be clickable to filter/exclude specific values.

Nice tool! Tested it with a larger csv and I am happy with it. :slight_smile:
Another point in terms of usability: Add a CSV file per Drag&Drop like in easymorph.

First, a bit of definitions.

Values that are explicitly selected are highlighted with blue color:
image

Values that are grayed are excluded from selection. They don't exist in the filtered subset of table rows. Therefore their current counts are always 0.
image

Finally, values that have no highlighting or graying are implicitly selected, i.e. they appear in the filtered subset of rows because of explicit selections in other columns.

image

Now, it's easy to explain what the selection links do:

All - explicitly select all values in the list. Makes sense only when there is a search string in the search box above.
Possible - explicitly select the currently implicitly selected value.
Excluded - explicitly select all values that are currently excluded. Makes sense with removing filters from other columns otherwise the filtered result will be empty.
None - remove selection from all values.

That's coming too!

1 Like

I had no doubt. :slight_smile::+1:

It seems really good, an amazing initiative we would like to see in easymorph of course.

Several points :

  • I did not find a way to change csv parameters after load (like if I missed the separator) => had to submit it again
  • No undo action => guess it will come later ?
  • Most important thing : csv is shown for its data, what we would be great in terms of analysis is to see the sum of numeric fields (automatic or we can define) : it would be powerful to have a behaviour like excel cross tables. At least you could make visible the sum of numeric fields like in easymorph ?

All of this would be expected in the zoom view of Easymorph, a more “analytic” view with filters and aggregations.

It's the "Reload" button:

image

We will add aggregations and extra profiling information eventually.

I don’t think the reload button enables to change a wrong property. For example if you did not choose the good separator, the reload button does not enable you to change it right ?

I know that aggregations is not very ETL spirit, you work more by table and by rows in a linear way. But Aggregations are a powerful analytic tool that may be included easily. If you believe it’s not in the spirit I can understand. However there is a place where you could introduce it, I mean introduce matrix : the charts in Easymorph. Today we can create bars but it would be great to create matrix :slight_smile:

And the top thing would be to be able to export it in excel thanks to the new excel export in january 2021 :slight_smile:

It does, try it :slight_smile:

Yes I can see that thanks

Hi Dmitry,

Thanks for providing this tool. I can see that I will find it invaluable.

Just a couple of quick observations. I’ve tried using Open With by right clicking on a CSV and associating it with CSViewer and this just opens CSViewer without the file. It would be great if that could open the file, or at least the dialog to pick the CSV properties for the file.

Another, nice to have, would be the ability to drag a CSV file into the empty CSViewer and have that either open the file, or the properties dialog.

Thanks again,
Steve

Hi Steve! Nice to see you on the Community forum :slight_smile:

You're spot on. The very next update of CSViewer will add opening files by dragging and dropping.

Thanks for reminding about this option. We will add it in the next update too. Check out the newer CSViewer in a month or so.

Other things we will be adding soon:

  • In-app notification about new versions
  • Main dataset sorting
  • Filtering by double-clicking values in the metadata table
  • Variable width of the filter boxes
  • Filtering by right-clicking counts in the filter boxes (e.g. select all values with count >= 2)

This is a pretty cool app. The drill-down filtering capabilities are really nice. However, I have some concerns about its performance.

Your website states that it can handle 500 million rows and that you only need 16 GB of RAM for more than 100 million rows. This implies that anything less than 100 million rows should load quickly and easily. I have a file that contains 6.7 million rows by 330 columns. On my 16 GB core i7 machine, It takes CSViewer several minutes to open this file. Maybe this is due to the large number of columns? Also, while I’m waiting for it to load, it displays the loading window, but it never updates the loaded record count, which leaves the user wondering if it’s crashed, or if it’s still working, or what.

So a couple of comments and suggestions:

  1. I’ve used other CSV-specific tools like csvEd and CSV Editor Pro, that can open this file instantly. They accomplish this by not attempting to load the entire file into memory. I realize CSViewer needs to load the entire file in order to calculate statistics, update the filters in real-time, etc… However, it would be better if it performed an immediate partial load, so the user could start viewing the records, then perform the statistical updates and filtering actions in the background. While the background process is running, it could display background activity icon, so the user would know that it’s still working on stuff and not to expect the stats to be available or the filters to work until its finished processing.Also, as the user scrolls down to different parts in the file, it should automatically prioritize loading those parts, thereby presenting a seamless UI experience, in terms of being able to view any part of the file without delay

  2. While it’s loading, it should display the total number of records loaded, along with a bar graph, so the user can see how much progress it’s made.

Also, it would be nice if the Table Metadata window included an incremental search box, to make it easier to filter matching column names by entering part of the name.

Thank you for the feedback @SoBeGuy. All duly noted. We will definitely keep improving CSViewer to make it faster and easier to use. Your suggestions are of great help.

Hey,

New to the page here so apologies if this shoud go elsewhere.

Started using CSViewer this year after searching for a long time for software that could handle larger datasets and was able to handle some filters/pivots/etc. CSViewer done the trick. Been using for maybe 3 months now and love it.

Recently I have experienced an issue stopping me from using it. I can launch the software ok but when I go to open file or drag one in it seems like the popup is hidden and clicking anywhere on the program screen gives the “cannot click” sound. Tried reinstalling a few times but no luck. Any suggestions would be appriciated :slight_smile: Video showing the issue :- Recording #21

Thanks,
Gavin.

Hi Gavin and welcome to the Community!

It could be that you switched monitors recently, and the dialog’s position is remembered for the monitor that is now missing. To resolve that, remove (or, better, rename) the application config file located at

C:\Users\<your username>\AppData\Local\EasyMorph\CSViewer\CSViewer.config.xml

After you do that, your application settings will be reset to defaults. You may lose your list of recent files.