Hello everyone,
I’ve got a strange situation and I hope to find a smart solution.
My recordset is something like this:
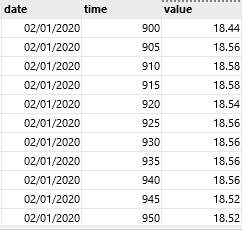
As you can see it’s a simple recordset with date, time (in a hhmm format) and the value of the product in that time.
I need to find the first value that decrease after the given time.
As example, using the above data:
- For 02/01/2020 time 900, the first value that decrease is 18.54 at 920
- For 02/01/2020 time 905, the first value that decrease is 18.54 at 920
- For 02/01/2020 time 910, the first value that decrease is 18.54 at 920
- For 02/01/2020 time 915, the first value that decrease is 18.54 at 920
- For 02/01/2020 time 920, the first value that decrease is 18.52 at 945
Someone can suggest some tricks to resolve this problem?
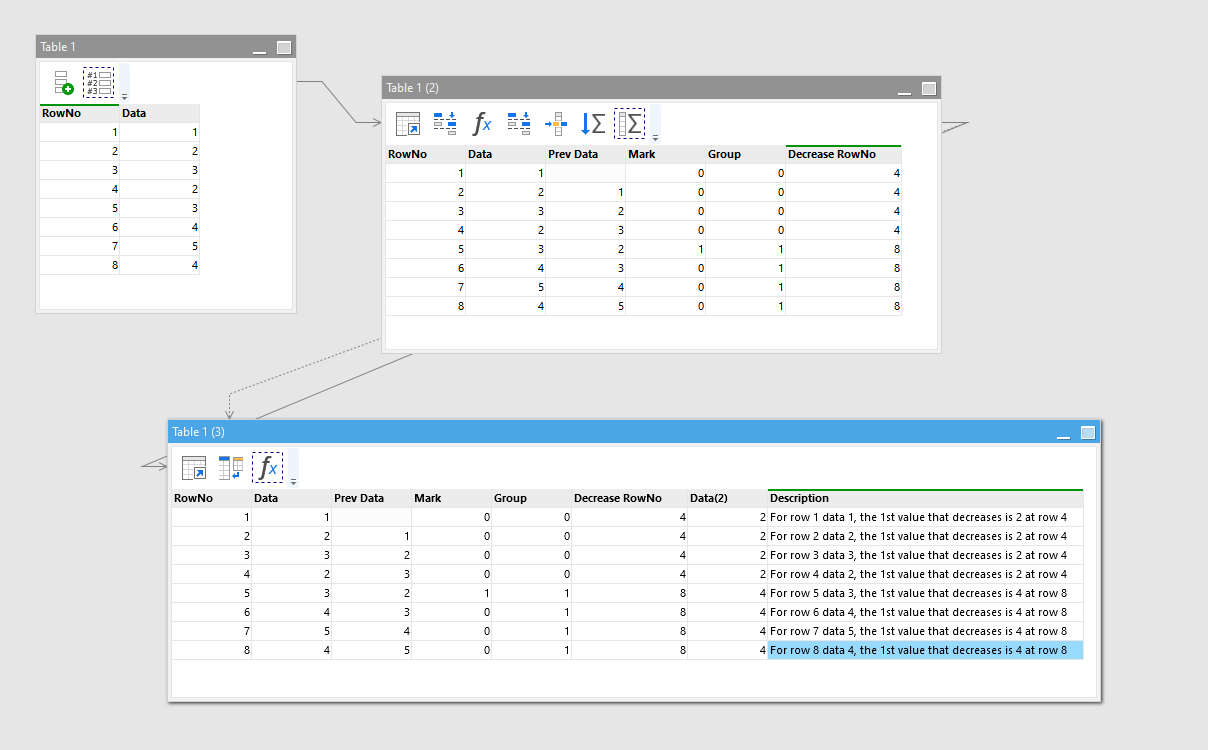
You can solve this by marking rows where the trend changes, i.e. where the previous row has a greater value than the current row. For that, you can add a new column with values shifted down by 1 row and compare them with the current value.
Once you have the rows with trend change marked, you can calculate groups that group rows of a growing trend. The last value in each group will be the decreased value. Therefore you can take the max time in each group and it will be the time of decrease. Finally, once you have the time of decrease, you can do a self-merge to bring in the decreased value in each group.
See the project below that illustrates the idea. RowNo is equivalent to time, and Data is equivalent to value.
find-decreases.morph (5.5 KB)
PS. Marking rows is a very powerful technique. Once you mark rows, it becomes more or less clear what to do next.
Amazing solution!
Easymorph once again proves to be a valid and complete tool, congratulations!
1 Like