There are absolutely no silly questions on the Community!!
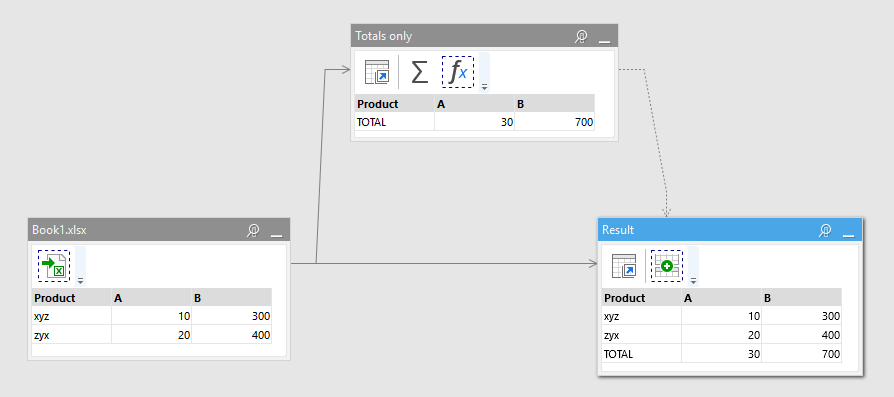
A total row would be calculated as aggregation in a derived table which is then appended to the main table at the bottom. See the example and screenshot below.
Thank you. I hope you understand I came from the old school of spreadsheet analysis. It took me more than 3 hours to figure out, that which took me now less than 3 minutes. I am compiling every bit of information because it will be my manual.
Hi. What if we want to sum each row separately and show it in a separate column? just like the opposite of what you have done considering columns maybe added automatically every month, (A,B,C,…)
Great Example, I was able to apply it to my latest requirement. Is there an eash way to calculate the percentage of total? Ex. Product XYZ = 10, ZYX = 20 and Total = 30, So what I was hoping to do is add a column between A and B called Pct of Total which would by 10/30 = 33% and 20/30 = 67% and the total % would add up to 100% Can this be done using EasyMorph?
Thanks for your resposne, I created a column using the subtotal action to count the total records. My next step was to aggregate the some fields and group by a column, at that point I loose my Total count. Is there a way to set the Total count to a parameter, then add a calculated field that would divided the aggregated total by the parameter?