For those too young to remember what AS/400 was, it was a computer ecosystems produced by IBM which became extremely popular in the late 1980’s and 1990’s. They were famous for their reliability, security and user interface sporting bright green text on a black background. AS/400 or similar systems could be found at the heart of almost every business at the time. Because these systems would now be more than 35 years old, you could be forgiven for assuming they were all superseded and replaced a long time ago. In fact, because they were so reliable and secure, businesses were often reluctant to replace them and so you’d be amazed how many hospitals, food suppliers and global car manufacturers still use them today. They’ve sometimes been hidden away behind a shiny new web user interface, but behind the scenes the good old reliable AS/400 is still doing all the important parts.
The reason I am writing this potted history lesson is because last week we received a question from a customer about whether it was possible to import data into EasyMorph from a series of files that were generated from an old AS/400 system. Because of their age, such systems were never intended to output data in a way that is conducive for use in other systems, especially modern data preparation or reporting tools such as EasyMorph. Instead, they normally output reports which are test based and intended for printing on a dot matrix printer. If you had to click that link to find out what a dot matrix printer was, you really are too young to remember.
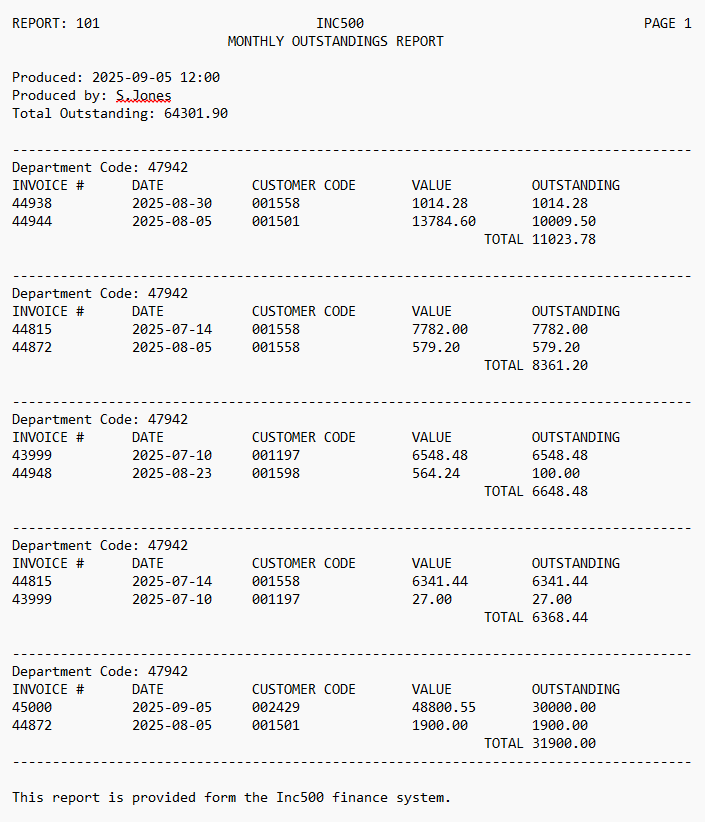
I'll include a copy of this example report as well as an EasyMorph project showing the solution at the bottom of this post.
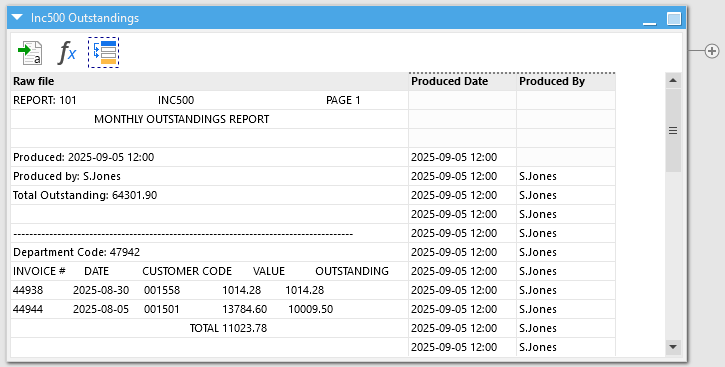
Such a report as can be seen above may contain sections of structured comma separated or
“fixed width” tables of data, but they are dispersed between other lines of text providing additional information or just to make the report look better when viewed by a person. You might think that it is nearly impossible to import such a report, but it is often possible in EasyMorph with a few little tricks.
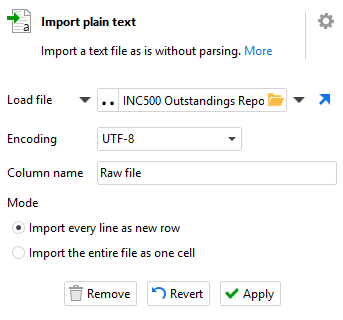
The first step is to get the report into EasyMorph. Now as the above example contains sections which are fixed width tables, you might instinctively reach for the “Import fixed width text” action. But doing so will actually make our lives harder later on. So instead, we’ll first use the “Import plain text” action which will import the report into a table with a single column and we’ll use the option to “Import every line as a new row”.
This is the first hurdle crossed and we have the raw file loaded in:
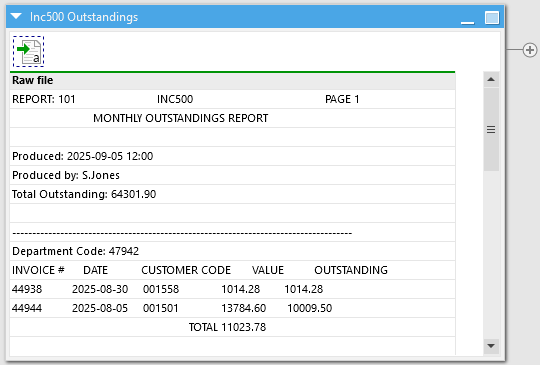
Don’t worry that the lines look like they’ve shifted a little, this is just due to the different fonts and won't cause us any issues.
The next and most important step is to identify patterns in the report which we can use to identify the lines we wish to extract. To start with, we want the “Produced” and “Produced by” information from towards the top of the report. This isn’t too hard to extract from the lines into another column using the “Calculate new column(s)” action. We can check if the lines start with the relevant piece of text and if they do then get the remainder of the line.
IF left([Raw file],10) = "Produced: " THEN
    mid([Raw file],11,len([Raw file])-10)
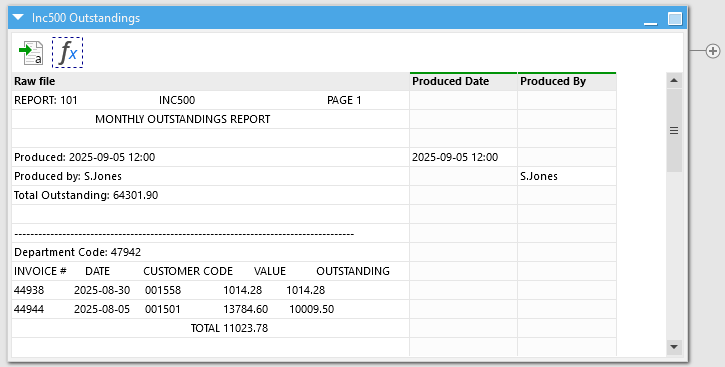
We now have these 2 parts sorted. But hang on, they’re only on their own lines I hear you say, they apply to all of the rows in this report don’t they? Don’t worry, we can sort that using the “Fill down” action to populate the same values down to all the other rows.
We miss a few lines at the top, but as things stand, The Produced and Produced By values are populated on all lines that contain the tabular data we care about and we’ll be getting rid of all other lines a little later on anyway.
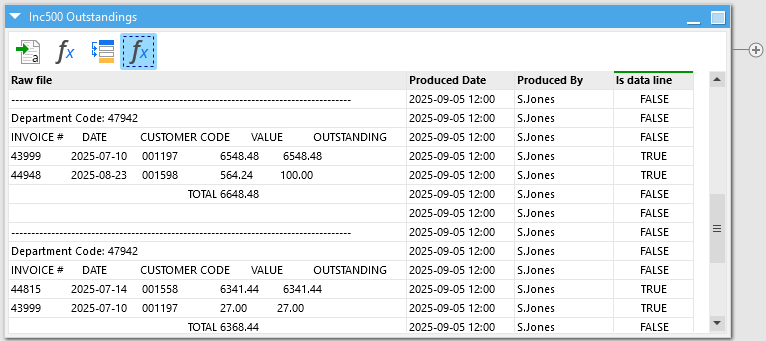
So how do we identify the lines which contain tabular data? The principal is pretty much the same. What pattern can we use to identify if each line is what we need. The first 5 characters of the line are a 5 digit invoice number and the 16th to 25th characters of the lines are all dates in the format “yyyy-MM-dd”. So we can test for these 2 things and be pretty confident if a line is one we want or not. Let’s calculate another column:
IF
    isnumeric(left([Raw file],5)) AND
    istextdate(mid([Raw file],16,10))
THEN
    true()
ELSE
    false()
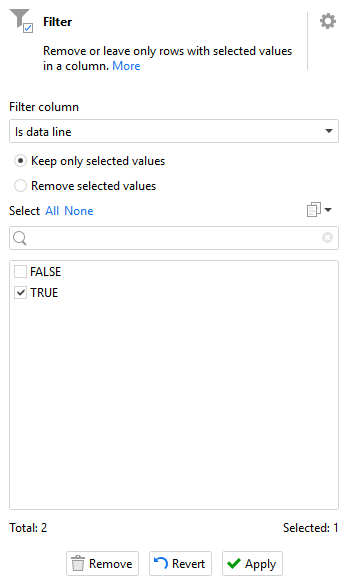
We can now use the “Filter” action to keep just those we’ve flagged as data lines:
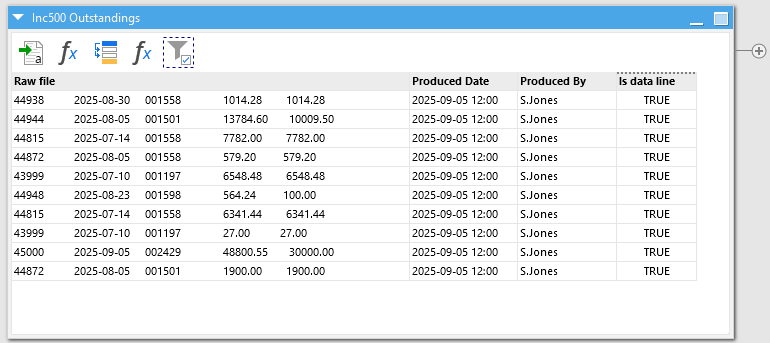
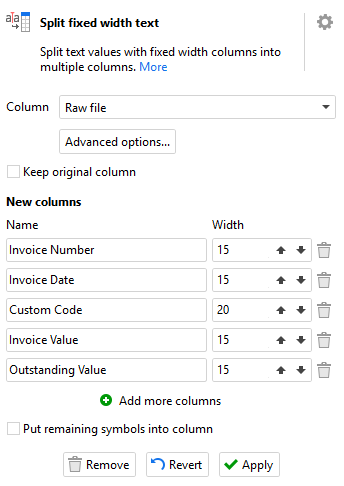
We’re nearly there - we just have one more problem to solve. The “Raw file” field still contains all of the fields from the file as a single long string. We need to split it up and thankfully, as well as the “Input fixed width text” action we dismissed at the start, EasyMorph also has a “Split fixed width text” action which does exactly the same thing but on text in a field already loaded into EasyMorph instead. Setting up the fixed width text actions is a little time consuming as we need to work out the max width of each field in the data - essentially how many characters wide can each field be. Most often you will just need to open the file in a text editor and start counting. For our example the fields are configured as follows:
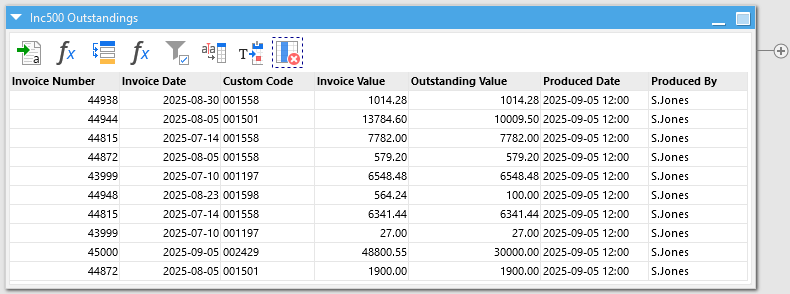
And if we take a look, we’ve pretty much cracked it. With the addition of a couple more actions to turn the text dates into proper numeric dates and to drop the “Is data line” column which we no longer need, we have an output that is ready for any merging, filtering and transformation we might wish to put it through.
Summary
In just a few simple steps, we’ve turned a complex, semi-structured text based report into structured usable data. Technically, for this example report it is possible to solve in slightly less steps, but I wanted to walk through it logically step-by-step as your report will inevitably be different.
Hopefully understanding the steps and having this example will allow you to tweak the logic to work for the patterns in your text reports.
Importing complex reports.zip (3.1 KB)