On the Tasks page of Easymorph Hub, is it possible to add in details of the most recent run? I often click into Tasks to see when it was last run, but having this detail up front would be ideal.
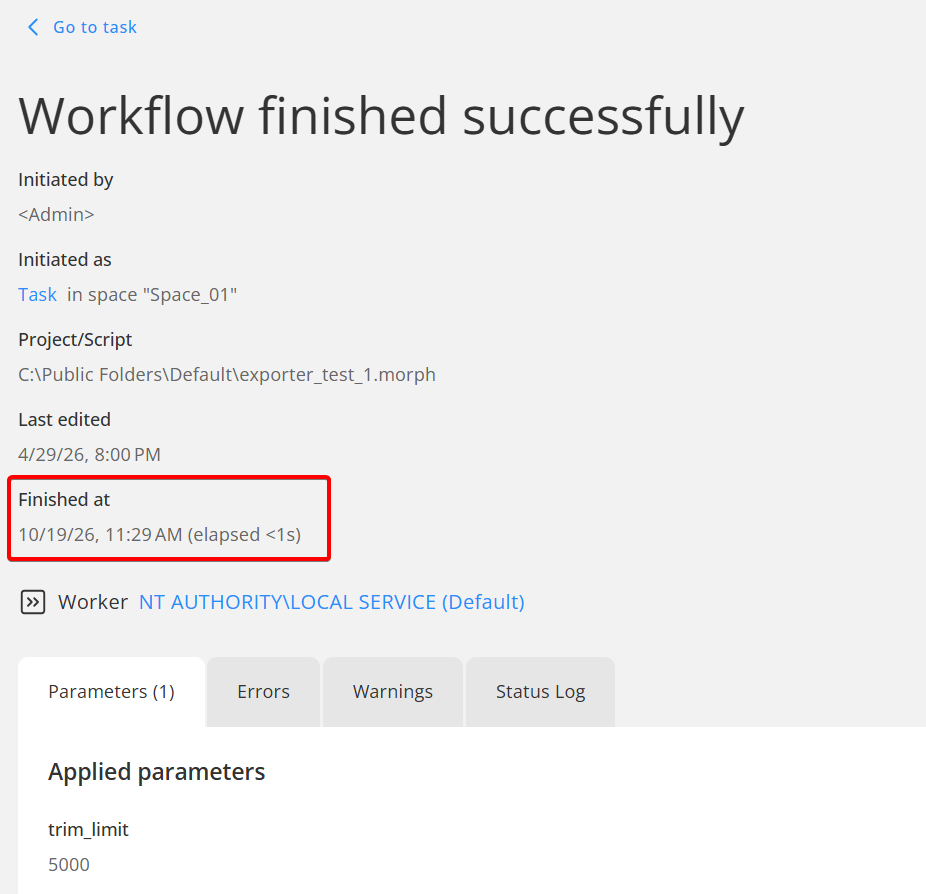
You can see the details of the most recent task run (and also previous runs) if you click on the value in column "Result" in Task Journal (Success or Failed/Canceled)
The information about the last run time is also included in details.
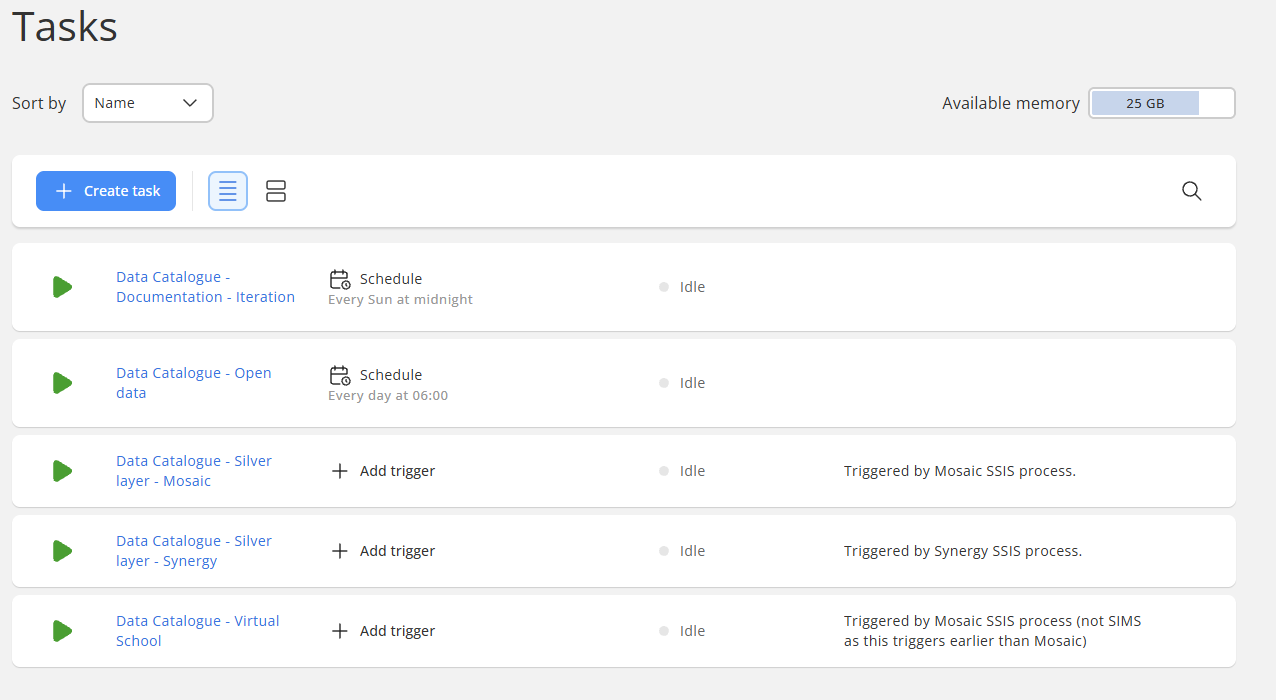
Sorry, re-reading my OP, I didn't make it clear. I'd like to see these details in the Tasks list view, so I don't need to click into anything, so I can just eyeball the whole list and spot anomalies. A 'days since last run' column would be great too:
Interestingly, EasyMorph Server showed the previous execution time in early versions. Then we introduced the ability to run multiple instances of a task and removed this indicator.
Indeed, it would be more convenient to see the last run result right in the list of tasks.
We wanted a better overview of our scheduled tasks and failed runs than the Hub UI gives out of the box. The approach is simple: export the raw data with EasyMorph, then use AI (Claude in our case) to analyse it and generate the views we found useful.
Data sources (all produced by EasyMorph itself):
The Hub journal. A scheduled EasyMorph task reads the journal events table (em_server_journal_events) and exports it to a Parquet file several times a day.
The task configuration XML files, copied from each space’s system folder by the same task. They give schedules, triggers, parameters and enabled/disabled status.
The .morph projects themselves, parsed as XML to find which files, connectors and other projects each workflow reads or writes.
Free RAM, recorded every minute by a small task running a PowerShell command.
What the dashboard shows:
Overview: number of runs, failures, success rate and the slowest tasks over the last 15 days.
Incidents instead of raw errors. Failures are grouped by root cause: expired Microsoft authorization, missing “Send As” permission, missing column, file not found, database timeout… Each incident lists the affected tasks and the upcoming runs at risk. It is marked “ongoing” or “recovered” automatically, once the failed tasks, or the connector involved, have succeeded again.
Duration anomalies. Each run is compared with the task’s usual duration. This flags slow runs, gradual drift and sudden changes in run time.
Planning: the schedule for the next 7 days, built from the trigger definitions, to spot overlaps and busy time slots.
RAM usage: minute by minute, with peaks above 90% matched against the tasks running at that moment.
Lineage: which project reads or writes which file, database or connector, and which tasks call other projects. Files are checked for existence and last modification date, which helps find outdated or orphan outputs. We also added our BI tool’s load scripts, to follow the data from the source system down to the reporting apps.
Lessons learned:
The journal holds much more than the Hub UI shows. Once it is in Parquet, any tool can analyse it.
Grouping failures into incidents changes everything: one expired connector authorization no longer looks like 20 unrelated failures.
The next step for us is to run the whole chain on the Hub itself (Python through “Call Python”) and publish the result as an HTML page in the space’s Pages feature.
Happy to share more details on the approach if anyone is interested.