Dset with multiple datagrids and analysis views within a single file

I am really liking the new changes that were made to combine the cross table/charts into the same data grid object. I feel like this is really powerful. It is definitely changing the way I conduct my own personal data analysis and I feel like it saves a ton of time.

Would it be too far out of bounds technically to be able to write multiple data grids with their accompanying analysis views to the same dset file? I work with data from many different systems and there is just no way to keep the outputs for the different use cases I have consolidated to a single datagrid/cross-table object. I am trying to share these outputs with other stakeholders internally but it would be neat if I could deliver with a single file instead of several.

Best

1 Like

I'm curious, what do you mean by "use cases" from a technical standpoint? Are the use cases different views of different subsets of rows of the same table? Can you provide an example?

Hi Dmitry,

I am thinking along the lines of being able to include the view and cross-tables from more than one table in a single Dset file.

I want to be able to prep all of the underlying outputs and consolidate them to a singular file that I can send out to a stakeholder so they don't have to do the work in setting up their own pivot tables in excel.

Here is a sample. And my apologies if I get too much into the weeds with my business specific work with this but it may convey what I am thinking about.

I mostly work with customer forecast data which for us is a dataset our customer provides to us indicating their intent to purchase. There are new items coming in and dropping out all the time. There are also delivery date request change that are constantly changing.

There are different ways we will look at this. Sometimes we just want to see what the state of our customer forecast. Sometimes we want to specifically see how the changes between a period of time may affect our fiscal half in the future.

The way I prep the underlying datasets in Easymorph to display this is different. So I want to consolidate both datagrids and the accompanying cross-tables/charts I might create into just a single file.

Another case, is where I may be looking at the an entirely different system that has a different purpose than the forecast. This would be, for example, a system that tracks the installation schedule of equipment. The columns and purpose of this dataset is completely different than in the case of the forecast but I would like to do prep work on this and include it with an output that also includes what I create for the forecast. Kind of like just having additional sheets in excel but instead of sheets, they are different Easymorph tables with their cross-tables/charts.

I guess if I were to further define my problem statement a bit more, I need to somehow get the semi complex work I am doing in Easymorph into a digestible format for upper level management. The way I have been doing this previously is creating a bunch of different views and aggregate style output tables written to a single excel file with a bunch of different sheets in them. The receiver would then sometimes put their own pivots on top. But now with the merger of the cross-tables/charts I feel like I can change this by having more consolidated base Easymorph tables with all of pivot tables and charts pre-created for them. Their work goes down and the visibility is increased significantly. If I get folks to start using the CSviewer and just upon up my prepped Dset, they can basically get all of the insight they are looking for in a consolidated manner. The analysis view, makes it very easy look at your data and save a lot of trouble that one would need to go through doing the same thing in Excel.

Best-

1 Like

Thank you for the details. I think I now understand the case much better, and it's actually in line with our long-term vision for the analytical part of EasyMorph:

Explorer View

EasyMorph projects will get a new feature for which I still don't have a name (maybe someone from the readers can suggest it). I call it Explorer View, but it's because I have to call it somehow.

The Explorer View will live in a new menu tab in the Workflow Editor, and it will have two components - a base data model and its Analysis View.

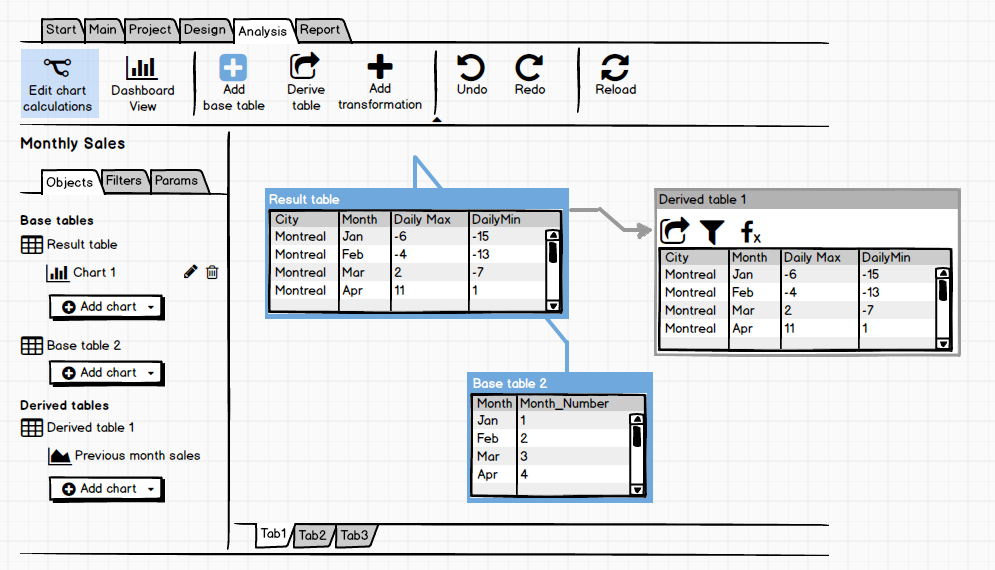
The base model consists of one or more tables picked from the workflow (including their charts). Let's call them base tables. The base tables may or may not be linked by primary/foreign keys. If two base tables are linked, filtering data in one table will automatically filter related data in another base table.

The Analysis View of the base model will include the base table(s) and their charts.

Computed or pre-computed Explorer View

Just like currently you can save a table into a .dset file and it will contain the table's Analysis View, it will be possible to export a project's Explorer View into a .dset file as well. In this case, the .dset file will contain multiple tables and multiple charts, which is very similar to what you described.

So a .dset file will play the role of a pre-computed Explorer View.

You can think of Explorer View as a superset of the current Analysis View.

:question: Should I call it Super-analysis View? Or maybe Business Analysis View? IDK.

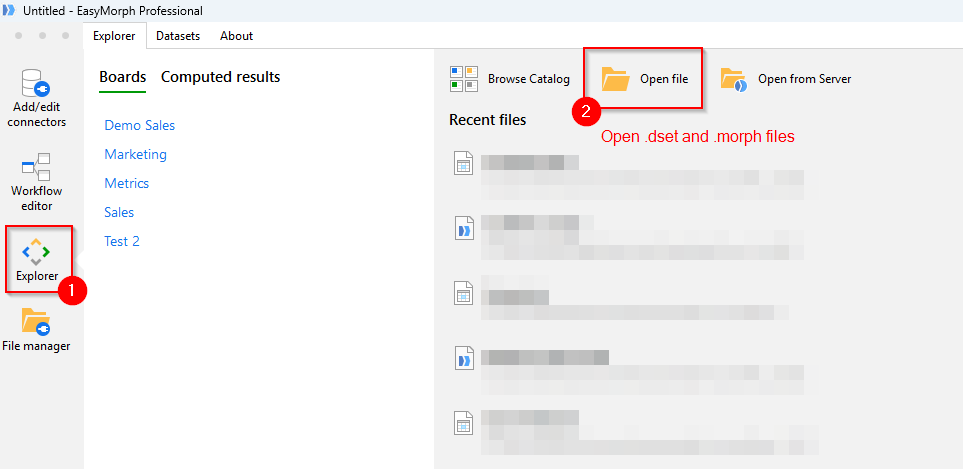
As it is currently, it will be possible to open .dset files in CSViewer or in Explorer of Desktop and Server. Hence the name "Explorer View".

However, the workflow itself will become a dynamically computed Explorer View. If you will open a .morph project in Explorer in Desktop, it will prompt for parameters, run, and present its Explorer View.

Actually, this already works in a simpler form - you can already open a .morph file in Explorer in Desktop, and it will prompt for parameters, run, and display the Analysis View of its result table
.

To wrap up:

  • Pre-computed Explorer View is a .dset file (can be opened in CSViewer or in Explorer in Desktop/Server)
  • Dynamically computed Explorer View is a .morph file (can be opened only in Explorer in Desktop/Server)
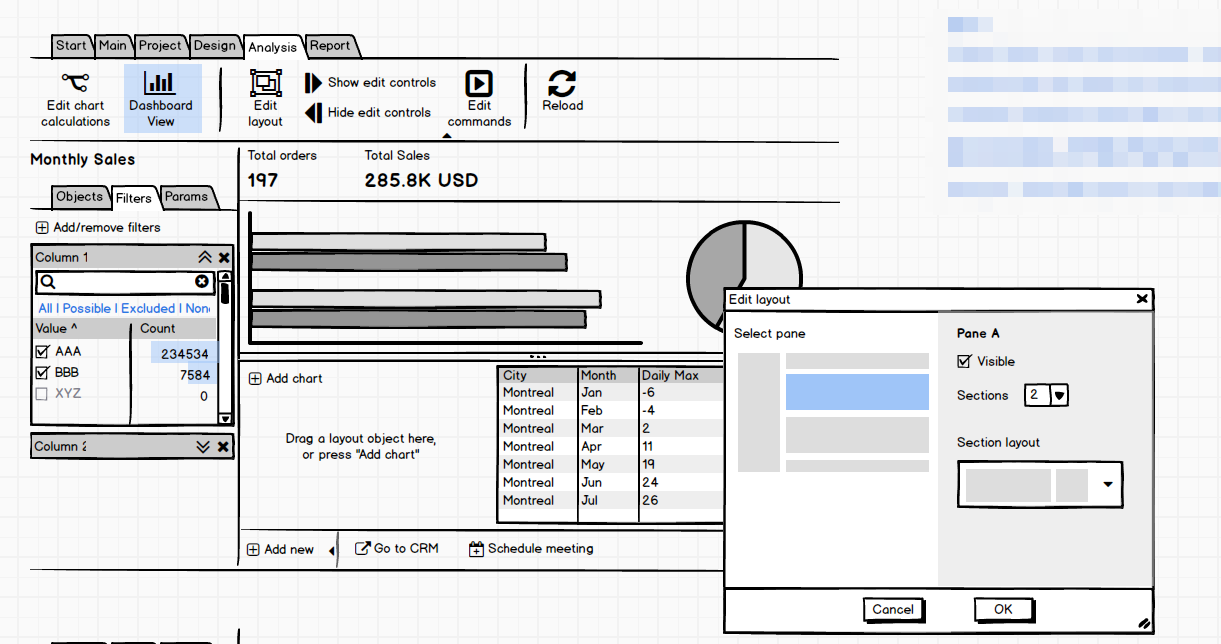
Dashboard mode

The Analysis/Explorer View will get a new mode - the dashboard mode. So, there will be two modes - the analysis mode (which already exists) and the dashboard mode. Both modes are based on the same base model and operate with the same charts but in a different way. The analysis mode is what you know currently as Analysis View - a table, filters, and charts.

The dashboard mode will look like a typical managerial dashboard - filters, aggregated metrics, and charts. Except, it will have a rather rigid layout with minimalistic customization options.

We think a dashboard mode is necessary because managers look at and work with data differently than analysts. Dashboards have never been a good tool for data analysis, but they are well-understood by decision-makers.

Analytical Engine

Currently, chart calculations are not very flexible. While charts in Analysis View are good enough for technical data analysis, they are not good for business data analysis that requires more advanced calculation logic.

Therefore, we will be adding a second, analytical, calculation engine for chart calculations. It will use absolutely the same design principle as the main workflow engine, but with a limited set of actions (basically only those from the "Transform" category) + derived tables. The starting point for the engine will be the base model.

All in all, we understand that data needs to be presented and analyzed for managerial purposes, and we have a vision of how to address that.

I don't have an exact timeline for all those features, but some of them will definitely appear in version 6 this year. The unification of tables and charts in v5.9 not only simplified things but also was a necessary preparation step for the new analytical features.

Thoughts?

2 Likes

Hi Dmitry,

Thank you so much for sharing this roadmap. This stuff sounds really exciting.

I would encourage you guys to think of ways to make the consumption of this as easy as possible. I have really tried to drive adoption at my company for Easymorph and from my perspective it is such a strong and powerful tool but old guard IT folks don't want to change their current methods. I can create output in Easymorph in a couple hours that would not even be on the list to be ignored by IT 6 months down the road. I am stuck in a weird shadow IT realm where I am creating great output in Easymorph but getting it converted to the managerial consumer is difficult. My managers are just very overwhelmed by the software so having them install and have access to .morph files and projects is just way beyond their level. That why when I saw the new feature combining the visualizations with the datagrid and just exporting that so the analysis view can be used with CSviewer something really clicked for me.

No doubt you guys are going to figure out something awesome. And I am really excited for the future. I have been using Easymorph for 5 years now and I absolutely love it. It really makes me feel like I have power over anything data related. Sure I may be a fake developer because I am using a no code tool but at the end of the day it is all about the output and what one can create given the base data they have access too. And bar none, I feel like empowers more than any other tool out there.

Have an awesome day!

Best-

1 Like

Thank you for the good words!

I wonder, if your organization uses a BI application such as Power BI or Tableau? In this case, you can push data to a BI app like that, and let the managers view it via a web browser. Of course, it adds a whole layer of complexity, but it can be a way to plug EasyMorph into the existing data technology stack that is approved and supported by the IT folks.

Hi Perk
I use the EM data to Power Bi all the time to share data with managers.
I also use EM to refresh Power Bi dataset linked to SQL as it is faster and you can fresh dataset more frequently in EasyMorph than schedule it in Power Bi itself.

I recommend you try it

Hi Rykie,

My apologies for the delayed reply. Thank you for taking the time out of your day to share how you are using EM with Power BI. If you don't mind me asking, what is your preferred flow for updating Power BI? Are you typically updating directly from EM -> with the Power BI Command Action? Or are you using EM to update a database that is linked to Power BI and that way?

Best wishes-