Hi,
I have a table like so,
Account Number Col1 Col2 Col3 Amount
0052364 Cash xx xx 120.00
0052364 Cash xx xx 138.50
0052364 Cash xx xx 141.21
I use this file to calculate a sum of Amount based on Account number so instead of 3 different values for the same account number I use group by ‘Account number’ to calculate the total amount. So the final output is:
Account Number Col1 Col2 Col3 Amount
0052364 xx xx xx 399.71
It works fine for now as there is just one account number in the file. But I need to prepare for a scenario where there might be a different account number in the file so I need to check if the account number is unique and if yes then group by account number, if not then group by similar account numbers.
Like:
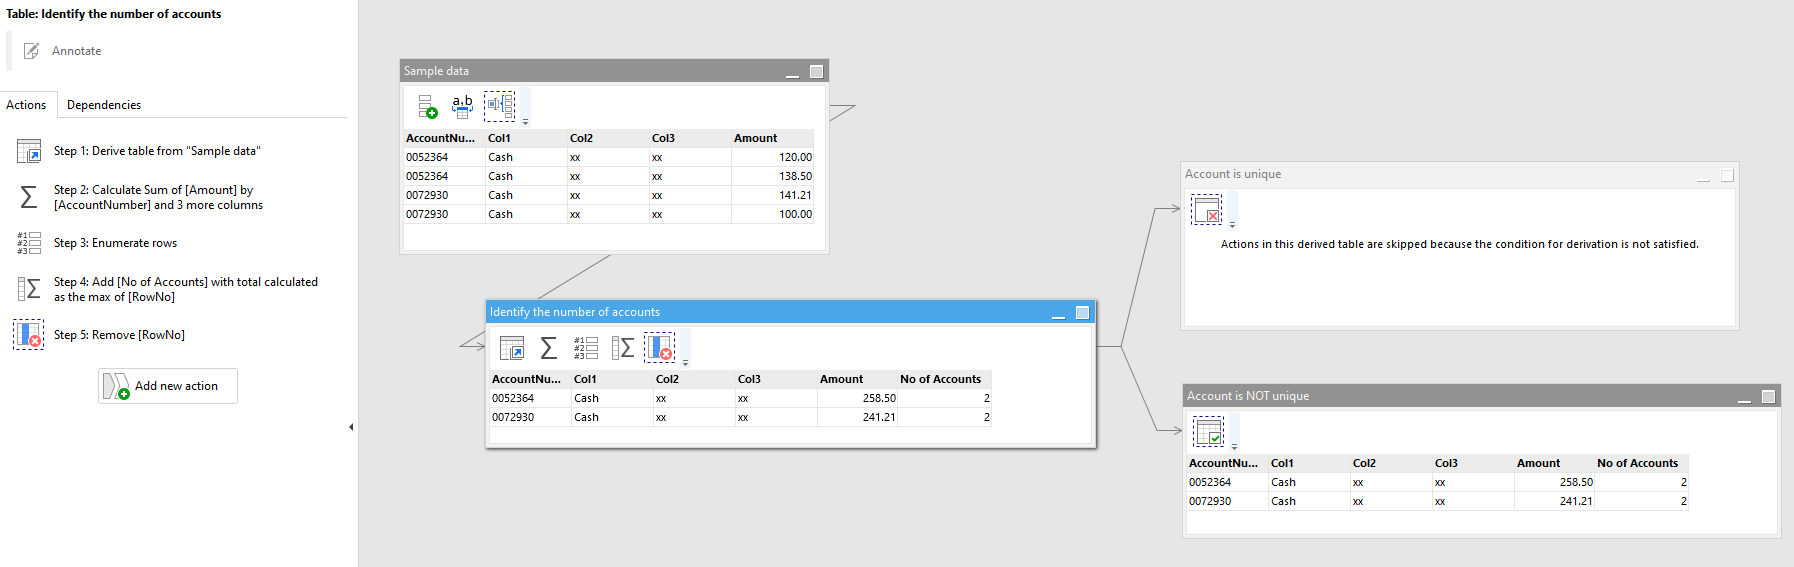
Account Number Col1 Col2 Col3 Amount
0052364 Cash xx xx 120.00
0052364 Cash xx xx 138.50
0072930 Cash xx xx 141.21
0072930 Cash xx xx 100.00
If the file comes in with a different account number, how do I identify that and group similar account numbers together?
Thank you
R