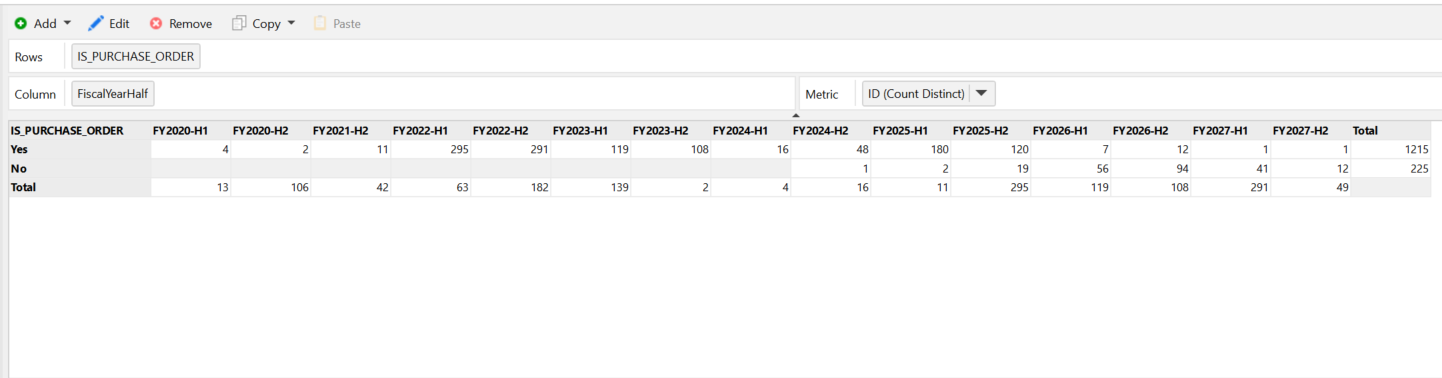
Quick question on the analysis view. What can cause the scenario in the image below? This cross table is based on a filter corresponding to 1440 records. The record totals look to be calculating properly at the row level. But the column totals do not look like they are totaling properly.
I am using count distinct on an ID. All of the IDs are unique and I checked that before placing any filters. When I change to count instead, the column totals do calculate properly.
I am not sure if this is user error on my side. Does anyone have any ideas?
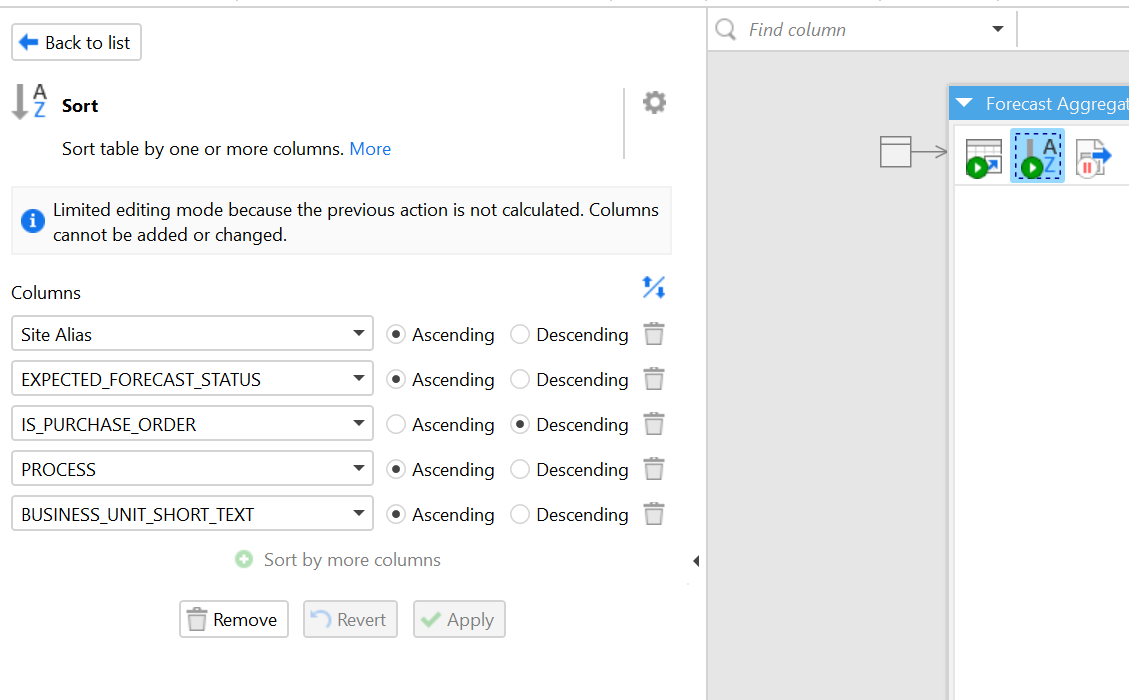
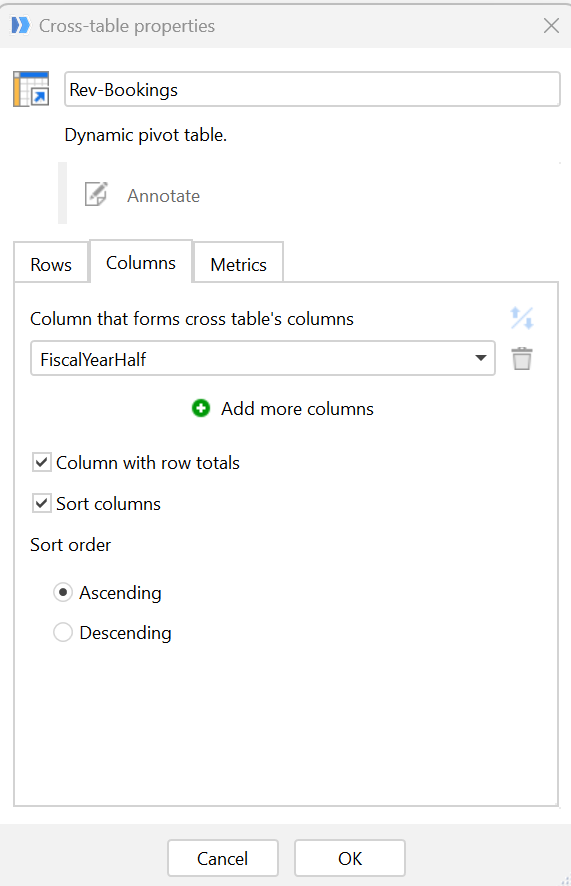
Could you please share which actions are executed prior to this? This includes any tables that this one derives from (if applicable). Please share a screenshot of the action icons (without data). Also, is the 'Sort Columns' option enabled in the Cross-Table properties?
My apologies for the delayed reply. I am in an Asia time zone.
It sounds like cause was found and you guys already updated! The Easymorph team is amazing.
Just in case, I will paste what I can. Unfortunately, I can not go too far back because there are some transformations that expose some customer data. But yes, I do have a sort placed.