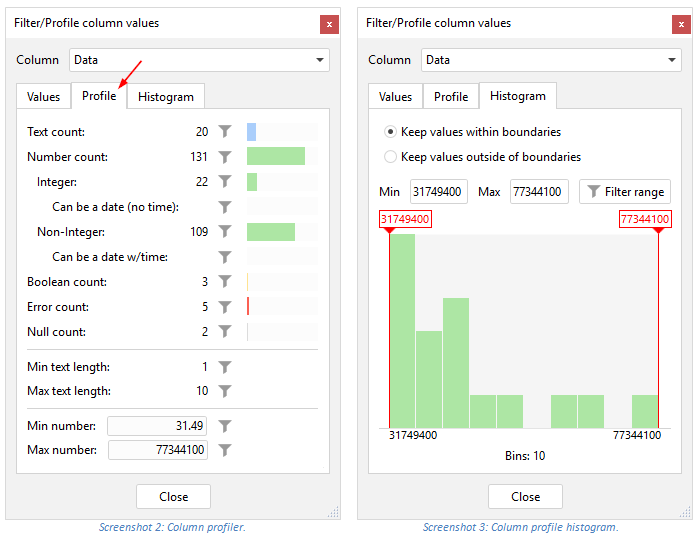
There is a feature many of today's data wranglers have : data quality on columns. You can see the different values, the distribution of values at a glance. You can also filter dynamically using the same screen and see the distribution of other columns changing at the same time.
You could think of a new panel at the bottom of easymorph that could detail the content of columns in the table the user has selected.
Also still looking forward to have the possibility to create cross table and export them, like you can do with chart.
Yes, the histogram shows distribution for numeric values. Counts for values not available in the profiler yet. If you need to see counts for distinct values, right-click the column and pick Aggregate/Count.
Okay, that’s a good start. Just waiting for values count and if possible interactions with bars to auto filter.
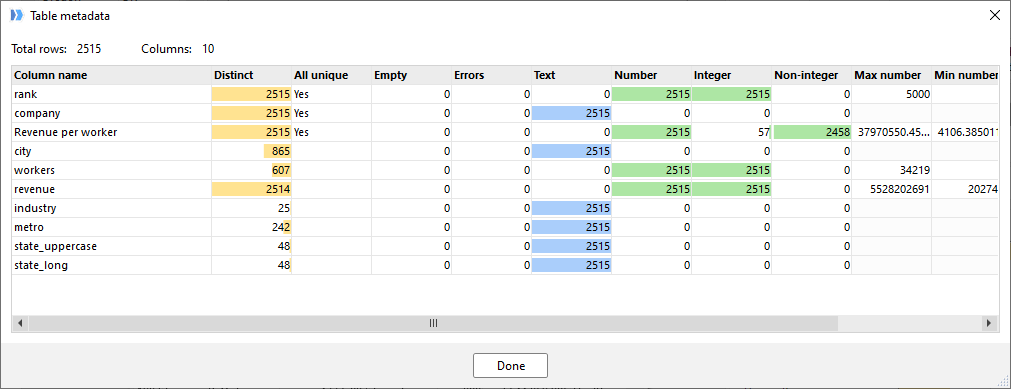
That could be a good thing. Also a dedicated panel with these informations on all columns (not one by one) could be nice !
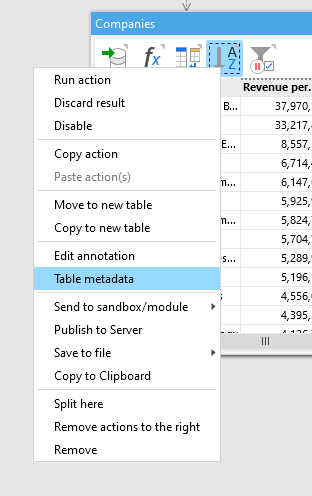
Good point ! Is there a workaround to achieve the profiling on all the columns with the current profiling options ? It does not seem possible yet because I cannot see an option to write the output of the profiling to a table ?
Does easyMorph forsee to elaborate the profiling options in the near future ?
I have installed the version 3.9 but it appears that the full-table profiling is not implemented yet ?
Is this still on the roadmap ? When will it be released ?
Any news on this topic? We would realy appreciate to be able to do automatic profiling of entire datasets so that we do not have to incorporate a set of tests in each project.