Hi. Does EM have an action that creates a chart or graph from data in a table?

The graph I added in from Excel.
Hi. Does EM have an action that creates a chart or graph from data in a table?
The graph I added in from Excel.
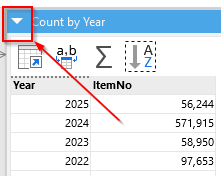
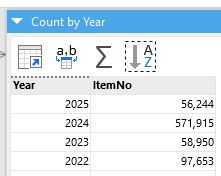
Any table can have an alternative representation in the form of a chart or cross table. You can switch the representations using the selector in the title bar (see below).
Uff, it looks like we forgot to add a "Rename" button after the chart redesign ![]() You can still rename the charts using the Analysis View:
You can still rename the charts using the Analysis View:
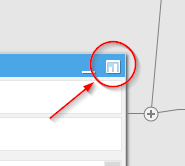
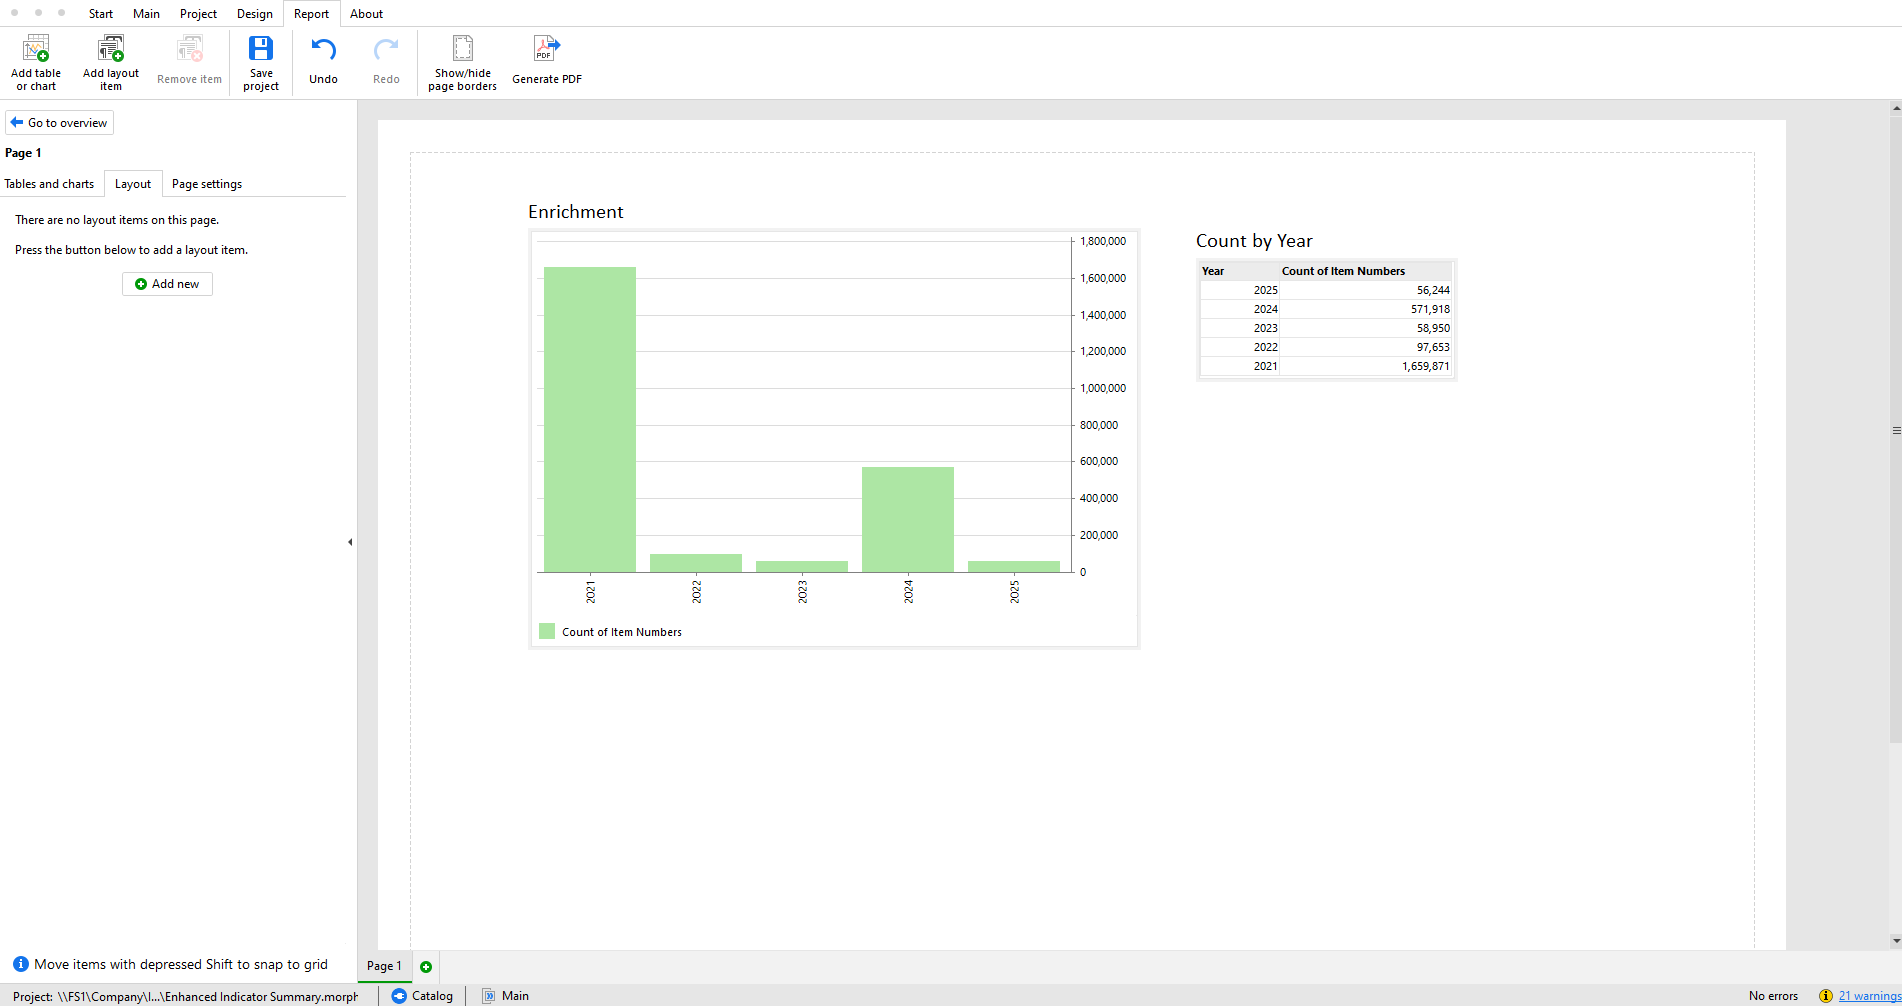
Click the "Maximize" button to go to the Analysis View
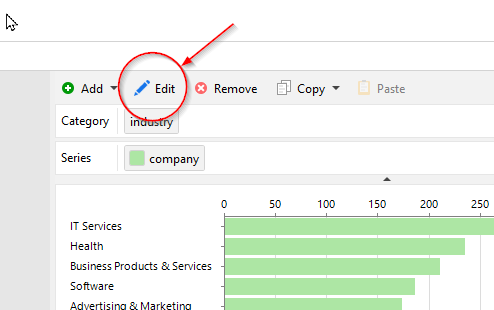
Press "Edit" above the chart
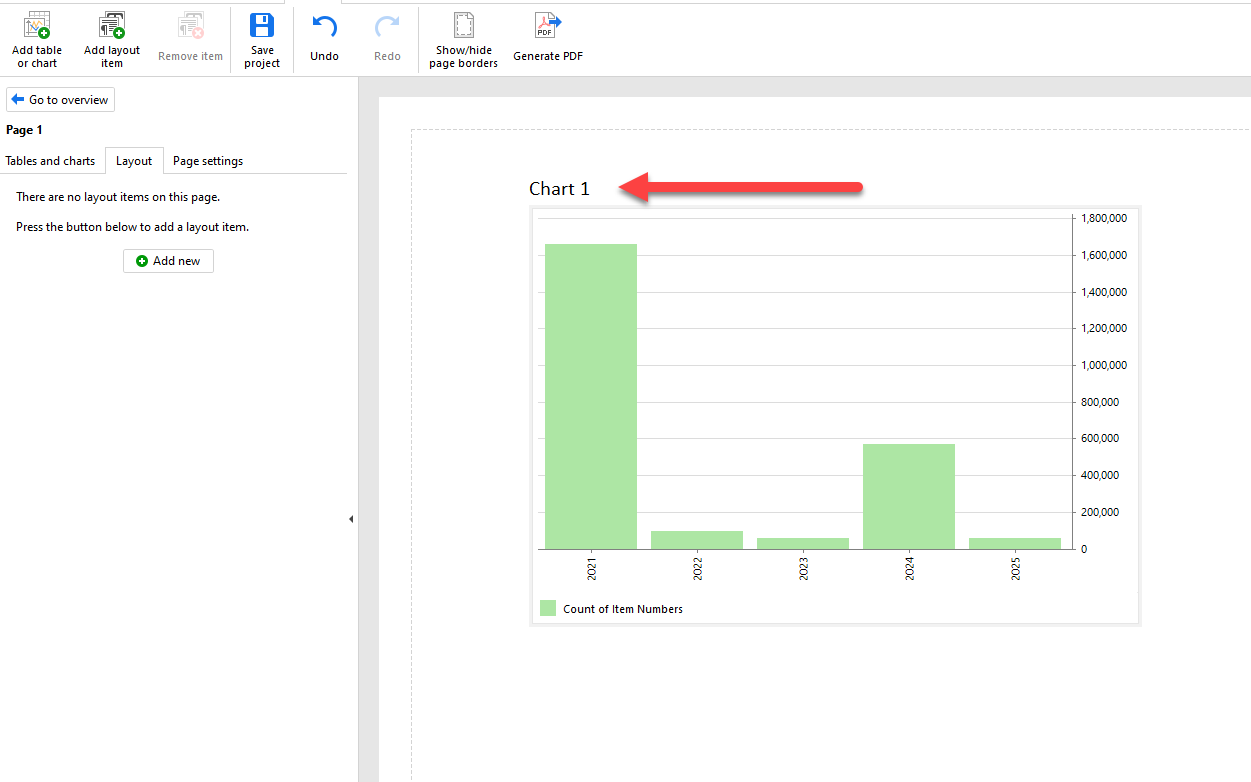
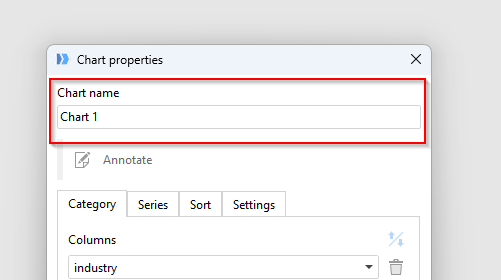
Edit the chart name
I have updated the Chart name and added to the Report tab in EM. Is there a way to set up an action to export the PDF and email the PDF?
Due to the current technical limitations, it's only possible to generate a PDF file by running a workflow in EasyMorph Desktop from the command line with the /report option. So effectively, you need to use the "Run program" action in EasyMorph to run itself from the command line.
See details here: PDF Report - Iteration